


Photo by Maxim Hopman on Unsplash
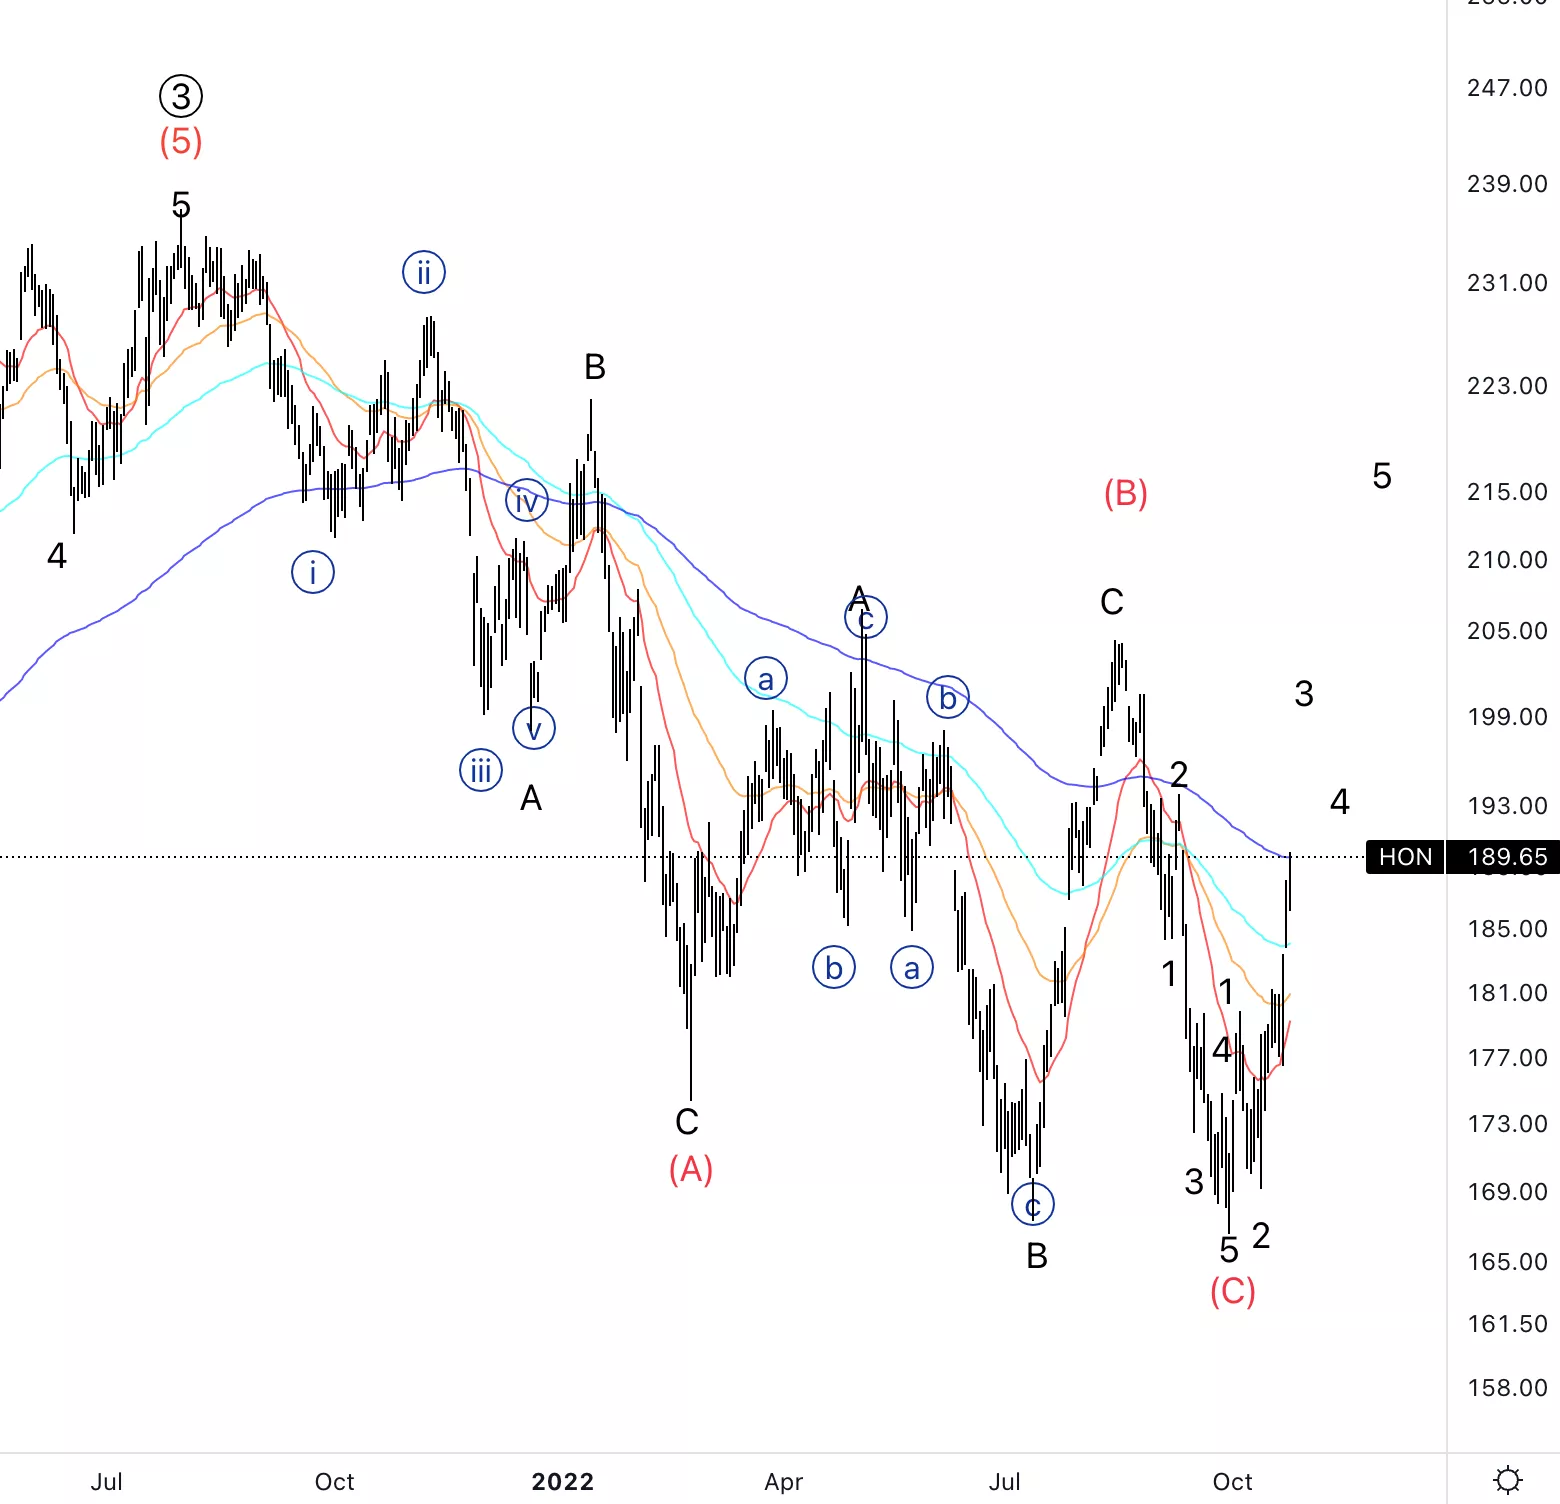
Honeywell International Inc., (Nasdaq: HON): Daily Chart, October 26, 2022,
HON Stock Market Analysis: There is a possibility we have a significant bottom in the place shown. The alternate would be we just completed wave 1 of (C).
HON Elliott Wave count: Wave 3 of (1)
HON Technical Indicators: We are now touching the 200EMA with strong upside momentum.
HON Trading Strategy: Concerning long-term positions, it’s better to wait for a break of wave (B)to invalidate the bearish alternate.
Analyst: Alessio Barretta
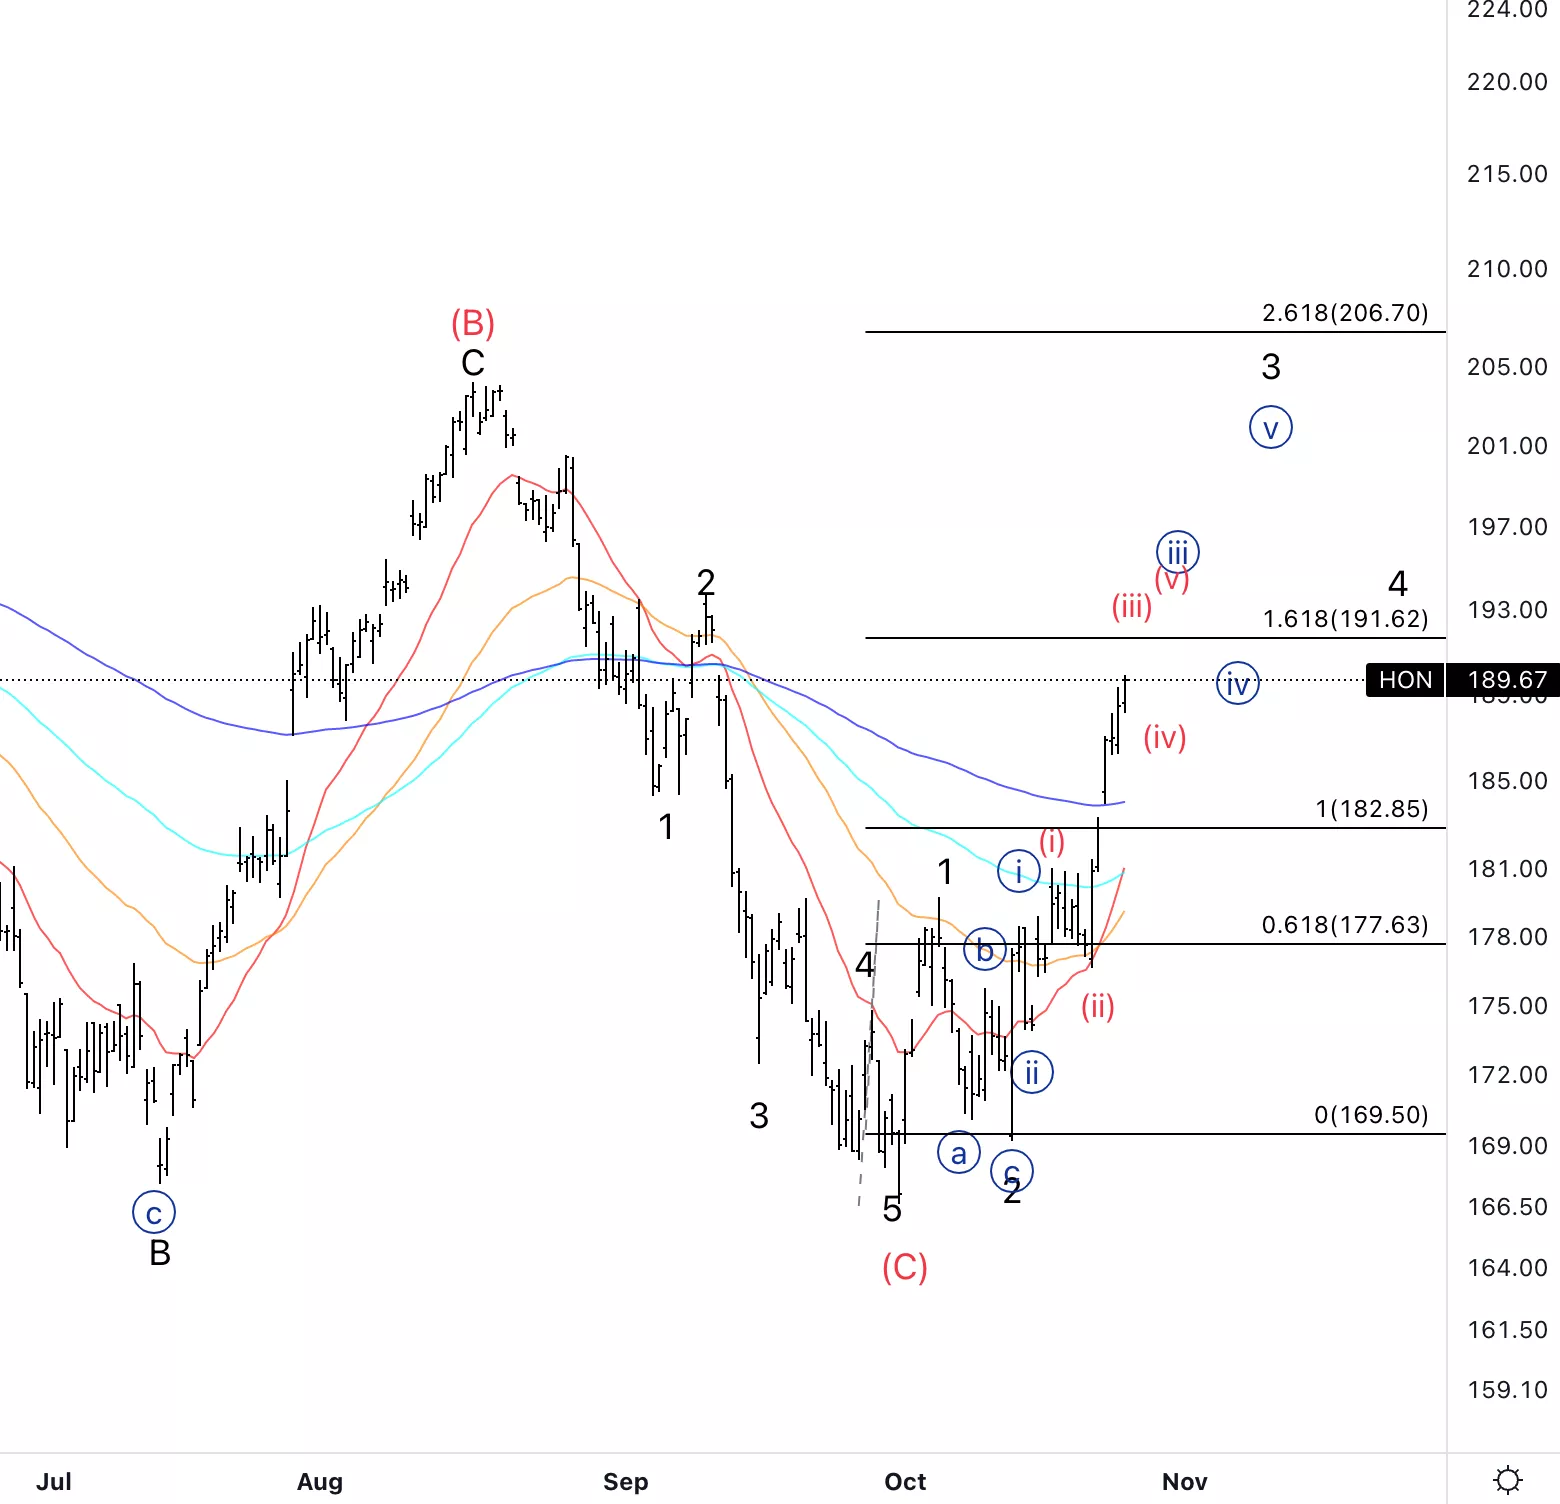
Honeywell International Inc., HON: 4-hour Chart, October 26, 2022
Honeywell International Inc., Elliott Wave Technical Analysis
HON Stock Market Analysis: Looking for a nest within wave 3 which should take us higher. We are close to 1.618 3 vs 1 as shown, however, if the count is unfolding as labeled we could easily expect to reach 2.618.
HON Elliott Wave count: Wave (iii) of {iii}.
HON Technical Indicators: Above all EMAs
HON Trading Strategy: Looking to place long on every three wave pullback starting from the potential upcoming wave (iv).
More By This Author:
Elliott Wave Analysis: US Indices - Wednesday, Oct. 26
Elliott Wave Technical Analysis: PepsiCo Inc. - Tuesday, Oct. 25
Cardano (ADAUSD) Elliott Wave Technical Analysis 25 October 2022



Comments
Log in or sign up to join the conversation.