

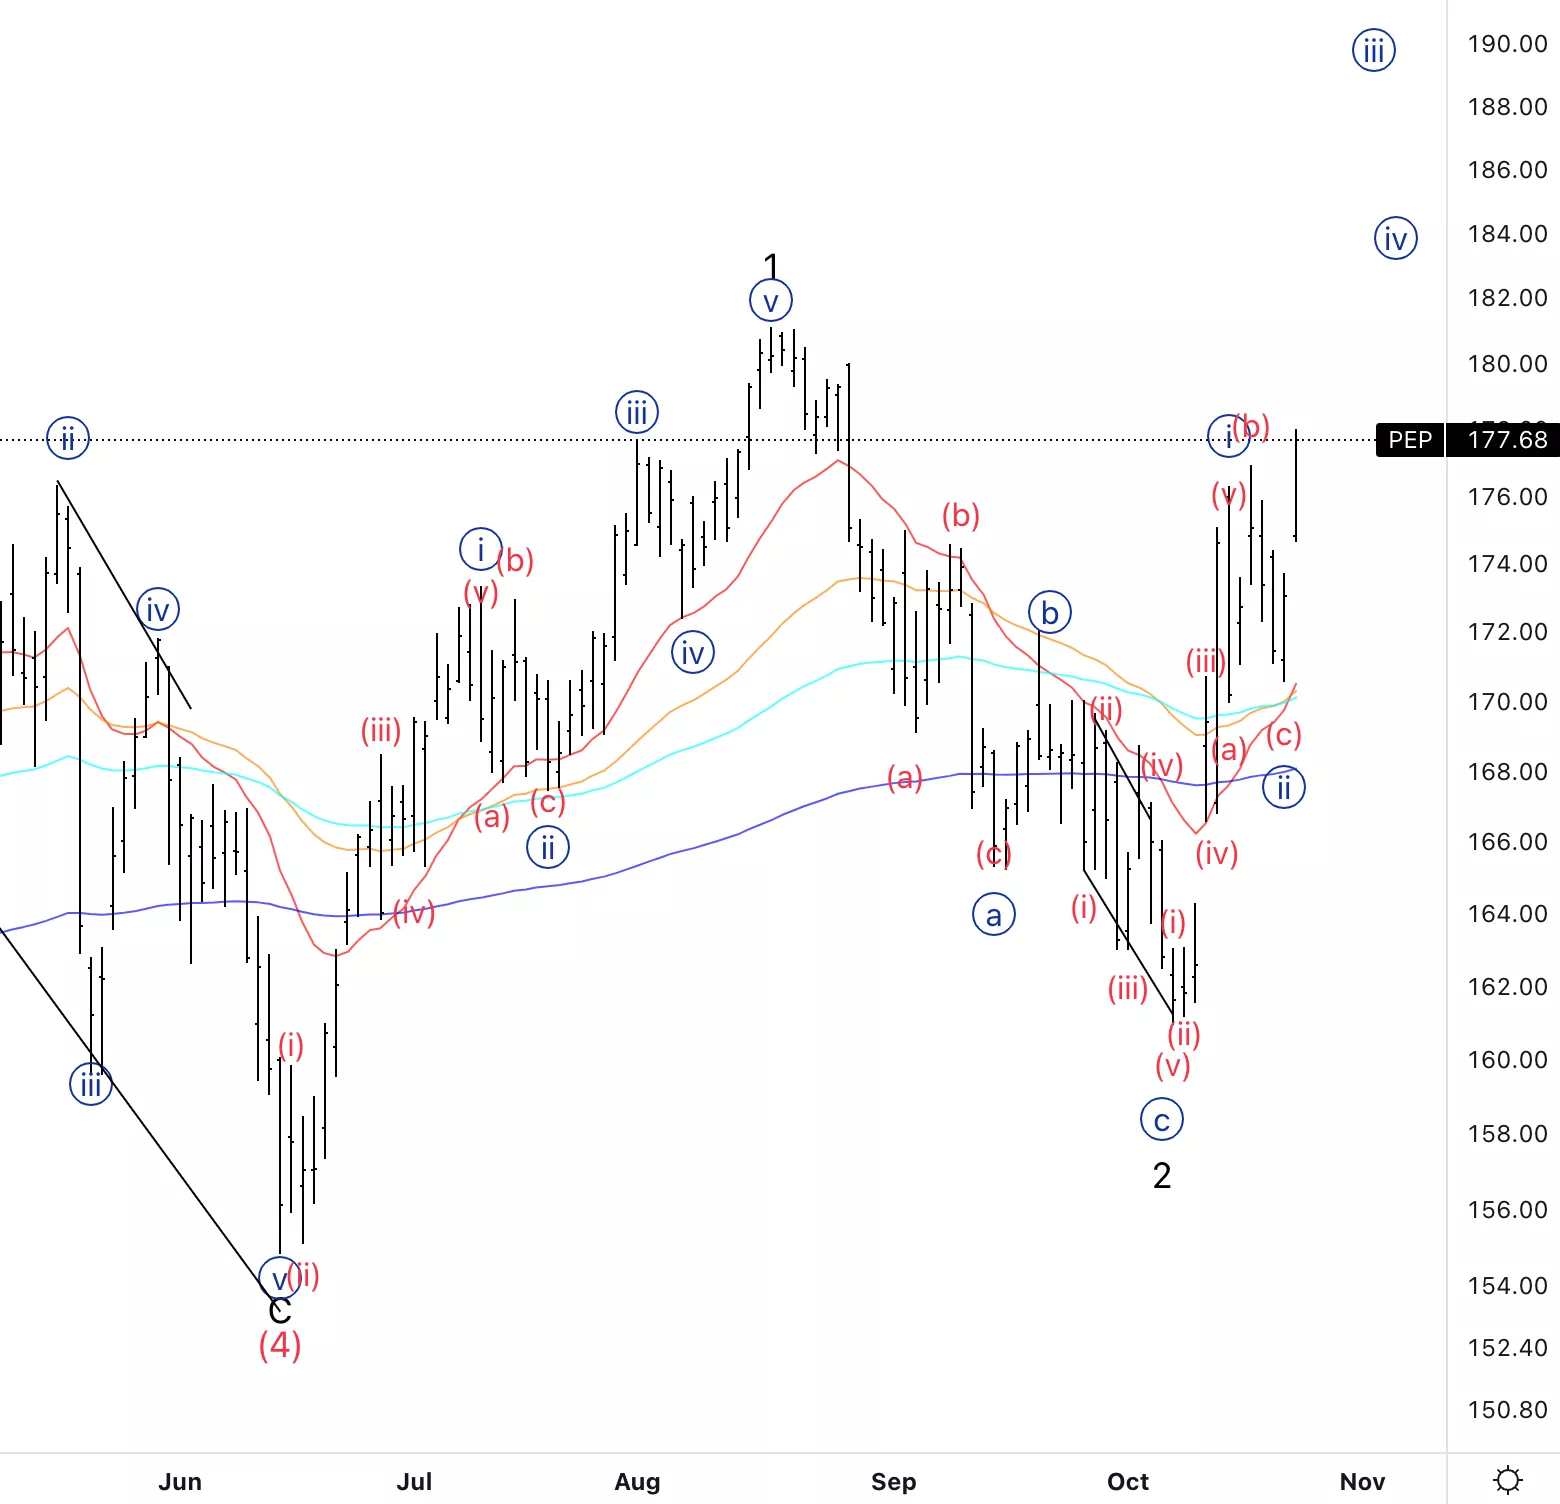
Pepsico Inc., (Nasdaq: PEP): Daily Chart, October 25, 2022,
PEP Stock Market Analysis: Moving as expected from the last update, we are looking for further upside at this point in the months to come. We will have additional confirmation once we break the previous ATH.
PEP Elliott Wave count: Wave {iii} of 3.
PEP Technical Indicators: We are above all EMAs.
PEP Trading Strategy: Looking to slowly build up longs on three-wave pullbacks to the upside.
Analyst: Alessio Barretta
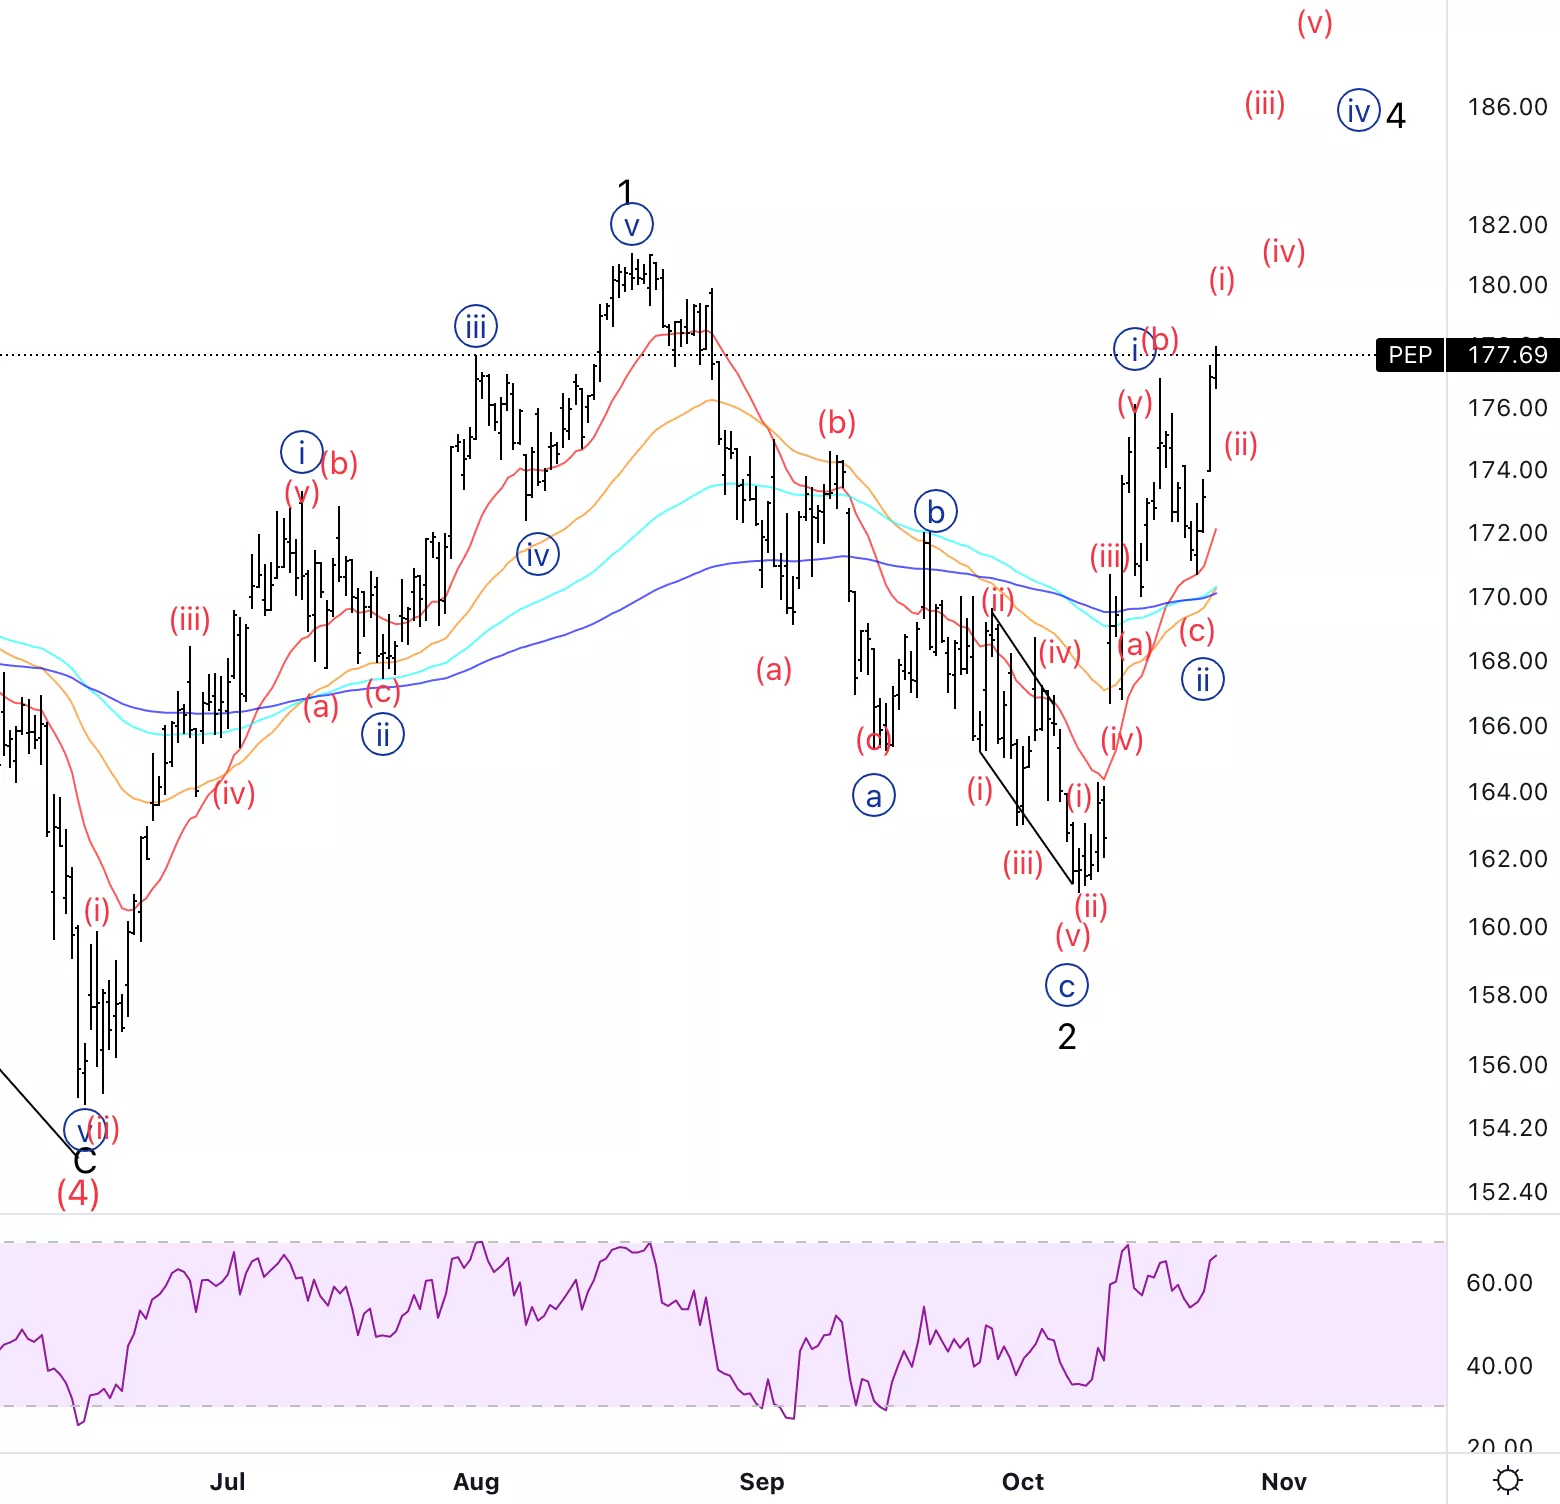
Pepsico Inc., PEP: 4-hour Chart, October 25, 2022
Pepsico Inc., Elliott Wave Technical Analysis
PEP Stock Market Analysis: Looking for every pullback to the downside to find support. We will try to take wave (ii) as the optimal entry point.
PEP Elliott Wave count: Wave (i) of {iii}.
PEP Technical Indicators: Above all EMAs with RSI starting to form bearish divergence to potentially indicate the end of wave (i).
PEP Trading Strategy: Looking for a clear three-wave move in wave (ii) to start placing longs.
More By This Author:
Cardano (ADAUSD) Elliott Wave Technical Analysis 25 October 2022
ASX200, CBA, IRON ORE, BHP, RIO, FMG, NCM, DXY, AUDUSD 2Yr Bonds Elliott Wave Technical Analysis
DAX 40 Today | DAX 40 Index Chart And Forecasts


Comments
Log in or sign up to join the conversation.