
Ethereum (ETH-x)

Technical Analysis
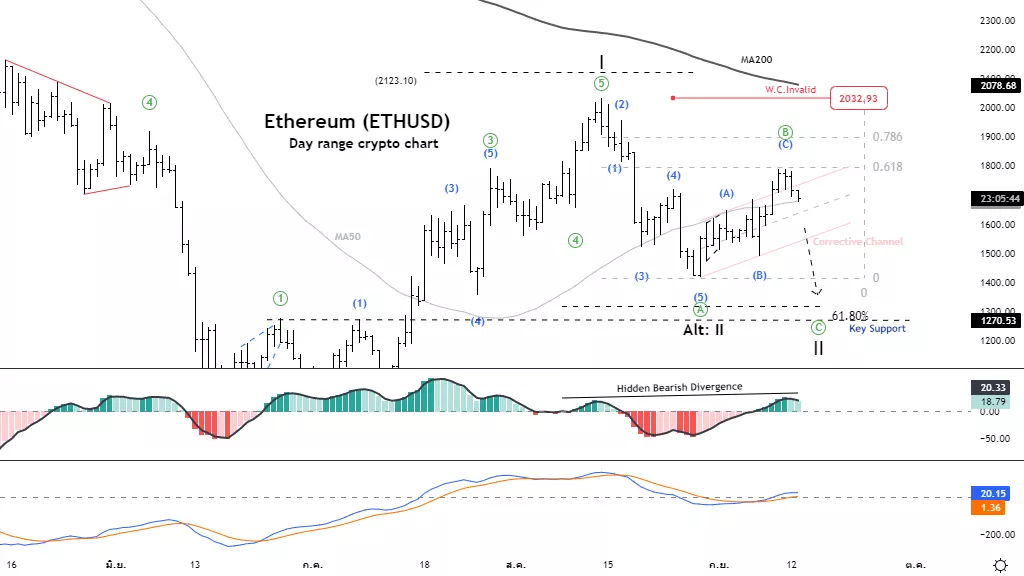
Function: Counter trend
Mode: Corrective
Structure: Zigzag
Position: Wave ((B))
Direction Next higher Degrees: Impulse wave (II)
Details: increases in wave ((B)) and decreases again in wave ((C)).
Wave Cancel invalid Level: 2022.93
Ethereum (ETHUSD) Trading Strategy: Bullish's efforts to drive prices higher. Failed to break through the resistance at 1800, allowing bearish sentiment to push the market
down again. Trading opportunity below 1400
Ethereum (ETHUSD)Technical Indicators: MACD Histogram has a hidden bearish
divergence ,the price has an opportunity reversal.
Ethereum (ETHUSD)
ETHUSD Elliott Wave Technical Analysis
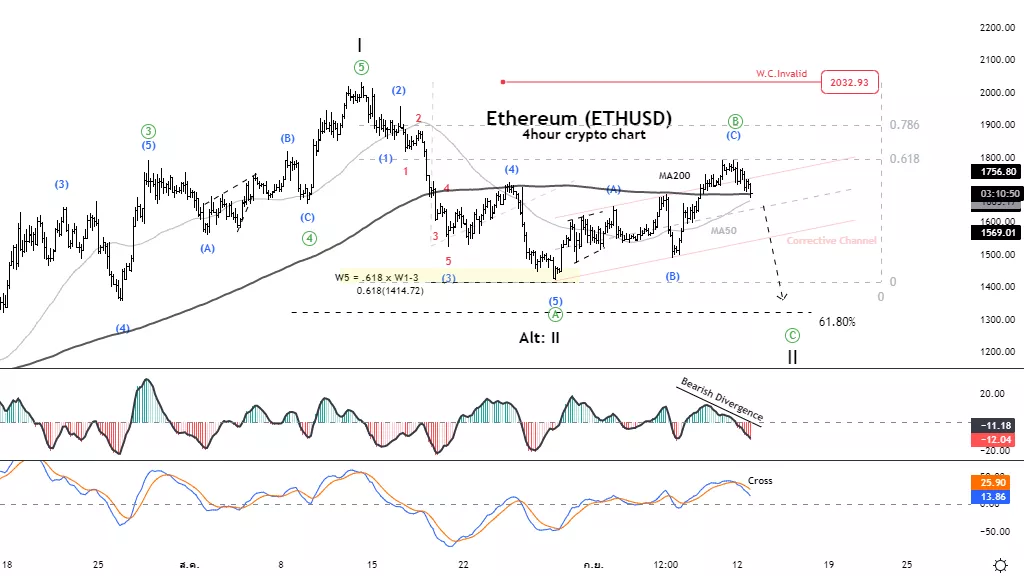
Function: Counter trend
Mode: Corrective
Structure: Zigzag
Position: Wave ((B))
Direction Next higher Degrees: Impulse wave (II)
Details: increases in wave ((B)) and decreases again in wave ((C)).
Wave Cancel invalid Level: 2022.93
Ethereum (ETHUSD) Trading Strategy: Bullish's efforts to drive prices higher however it
failed to break through the key resistance at 1800, allowing bearish sentiment to push the market
down again. Trading opportunity below 1400.
Ethereum (ETHUSD) Technical Indicators: MACD Histogram has a bearish
divergence, the price has an opportunity reversal.
More By This Author:
Elliott Wave Analysis: Commodity Futures Markets, Monday, Sept. 12
Elliott Wave Technical Analysis - Sept. 12: Fortinet
Elliott Wave Technical Analysis, Sept. 12: Uniswap


Comments
Log in or sign up to join the conversation.