
DexCom Inc., Elliott Wave Technical Analysis

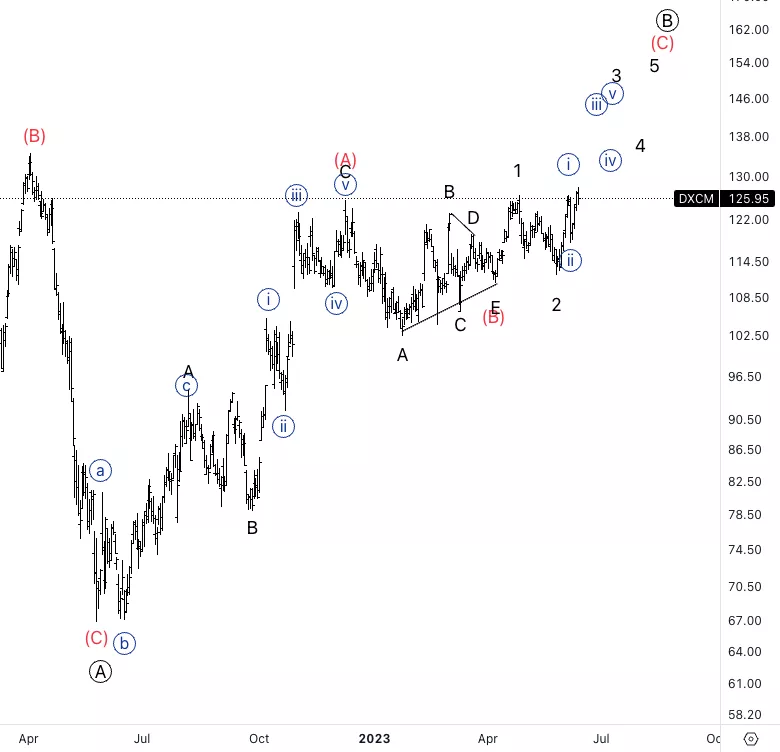
DexCom Inc., (DXCM): Daily Chart, Wednesday, June 14.
DXCM Stock Market Analysis: We are looking at the resumption of the uptrend as we expected in the last forecast. We finally broke the top of wave {i} and we are now looking for upside into wave (C).
DXCM Elliott Wave Count: Wave {iii} of 3.
DXCM Technical Indicators: Above all averages.
DXCM Trading Strategy: Looking for upside to unfold into wave {iii}.
TradingLounge Analyst: Alessio Barretta
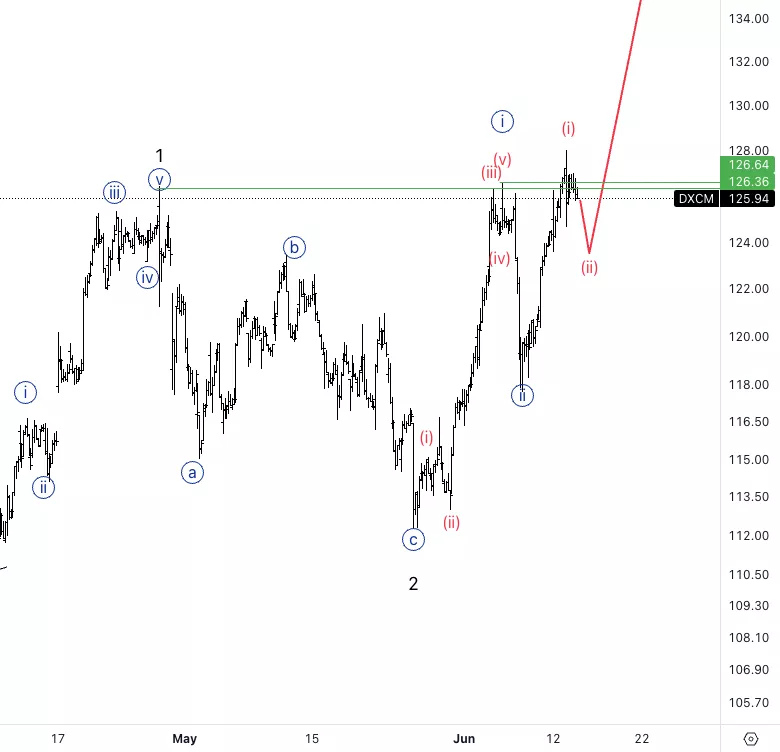
DexCom Inc., DXCM: 1-hour Chart, Wednesday, June 14.
DexCom Inc., Elliott Wave Technical Analysis
DXCM Stock Market Analysis: We are looking at a potential wave (i) of {iii} completed as we have broken the top of wave 1 with wave {i} of 3 and then we did the same with wave (i) of {iii}.
At this point we can look for another leg lower to complete wave (ii) and then seek for upside resumption.
DXCM Elliott Wave count: Wave (ii) of {iii}.
DXCM Technical Indicators: Above all averages.
DXCM Trading Strategy: Looking for one last leg lower to then resume upside.
More By This Author:
Commodity Markets: Elliot Wave Analysis - Precious Metals, Forex And Crude Oil - Wednesday, June 14
Elliott Wave Technical Analysis: Shopify Inc. - Tuesday, June 13
Elliott Wave Technical Analysis: Binance, Tuesday, June 13


Comments
Log in or sign up to join the conversation.