

Image Source: Pixabay
Shopify Inc., Elliott Wave Technical Analysis
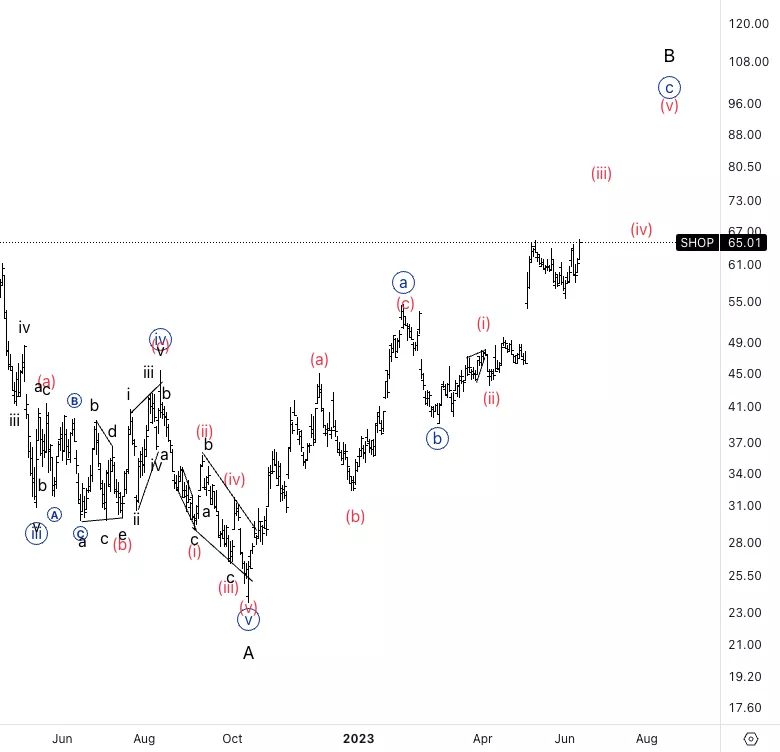
Shopify Inc., (Nasdaq: SHOP): Daily Chart, 13 June 2023.
SHOP Stock Market Analysis: Looking for further upside into wave B as we seem to be moving higher into wave {c} of B. We are now sitting at the 61.8% {c} vs. {a} as we aim towards equality at 90$.
SHOP Elliott Wave Count: Wave {c} of B.
SHOP Technical Indicators: Above all averages.
SHOP Trading Strategy: Looking for upside to unfold into wave {c}.
Analyst: Alessio Barretta
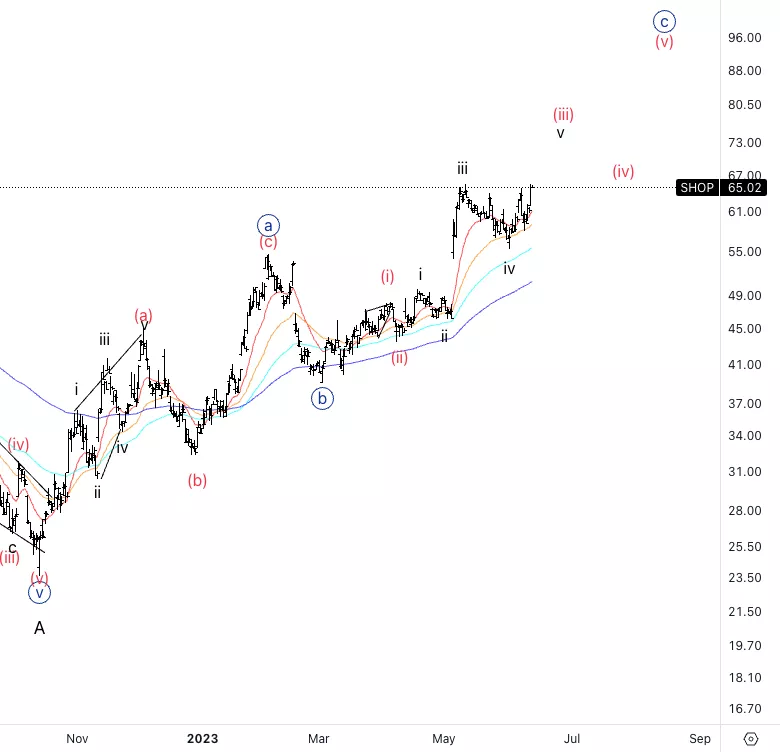
Shopify Inc., SHOP: 4-hour Chart,13 June 2023.
Shopify Inc., Elliott Wave Technical Analysis
SHOP Stock Market Analysis: We seem to be in wave v of (iii) as the most recent pullback in what could be wave iv seems to be a three wave move, therefore corrective in nature.
SHOP Elliott Wave count: Wave v of (iii).
SHOP Technical Indicators: Above all averages.
SHOP Trading Strategy: Looking for into wave as we extend higher.
More By This Author:
Elliott Wave Technical Analysis: Binance, Tuesday, June 13
Elliott Wave Technical Analysis: Monster Beverage, Monday, June 12
Elliott Wave Technical Analysis: AAVE Token, Monday, June 12


Comments
Log in or sign up to join the conversation.