
DexCom Inc., Elliott Wave Technical Analysis

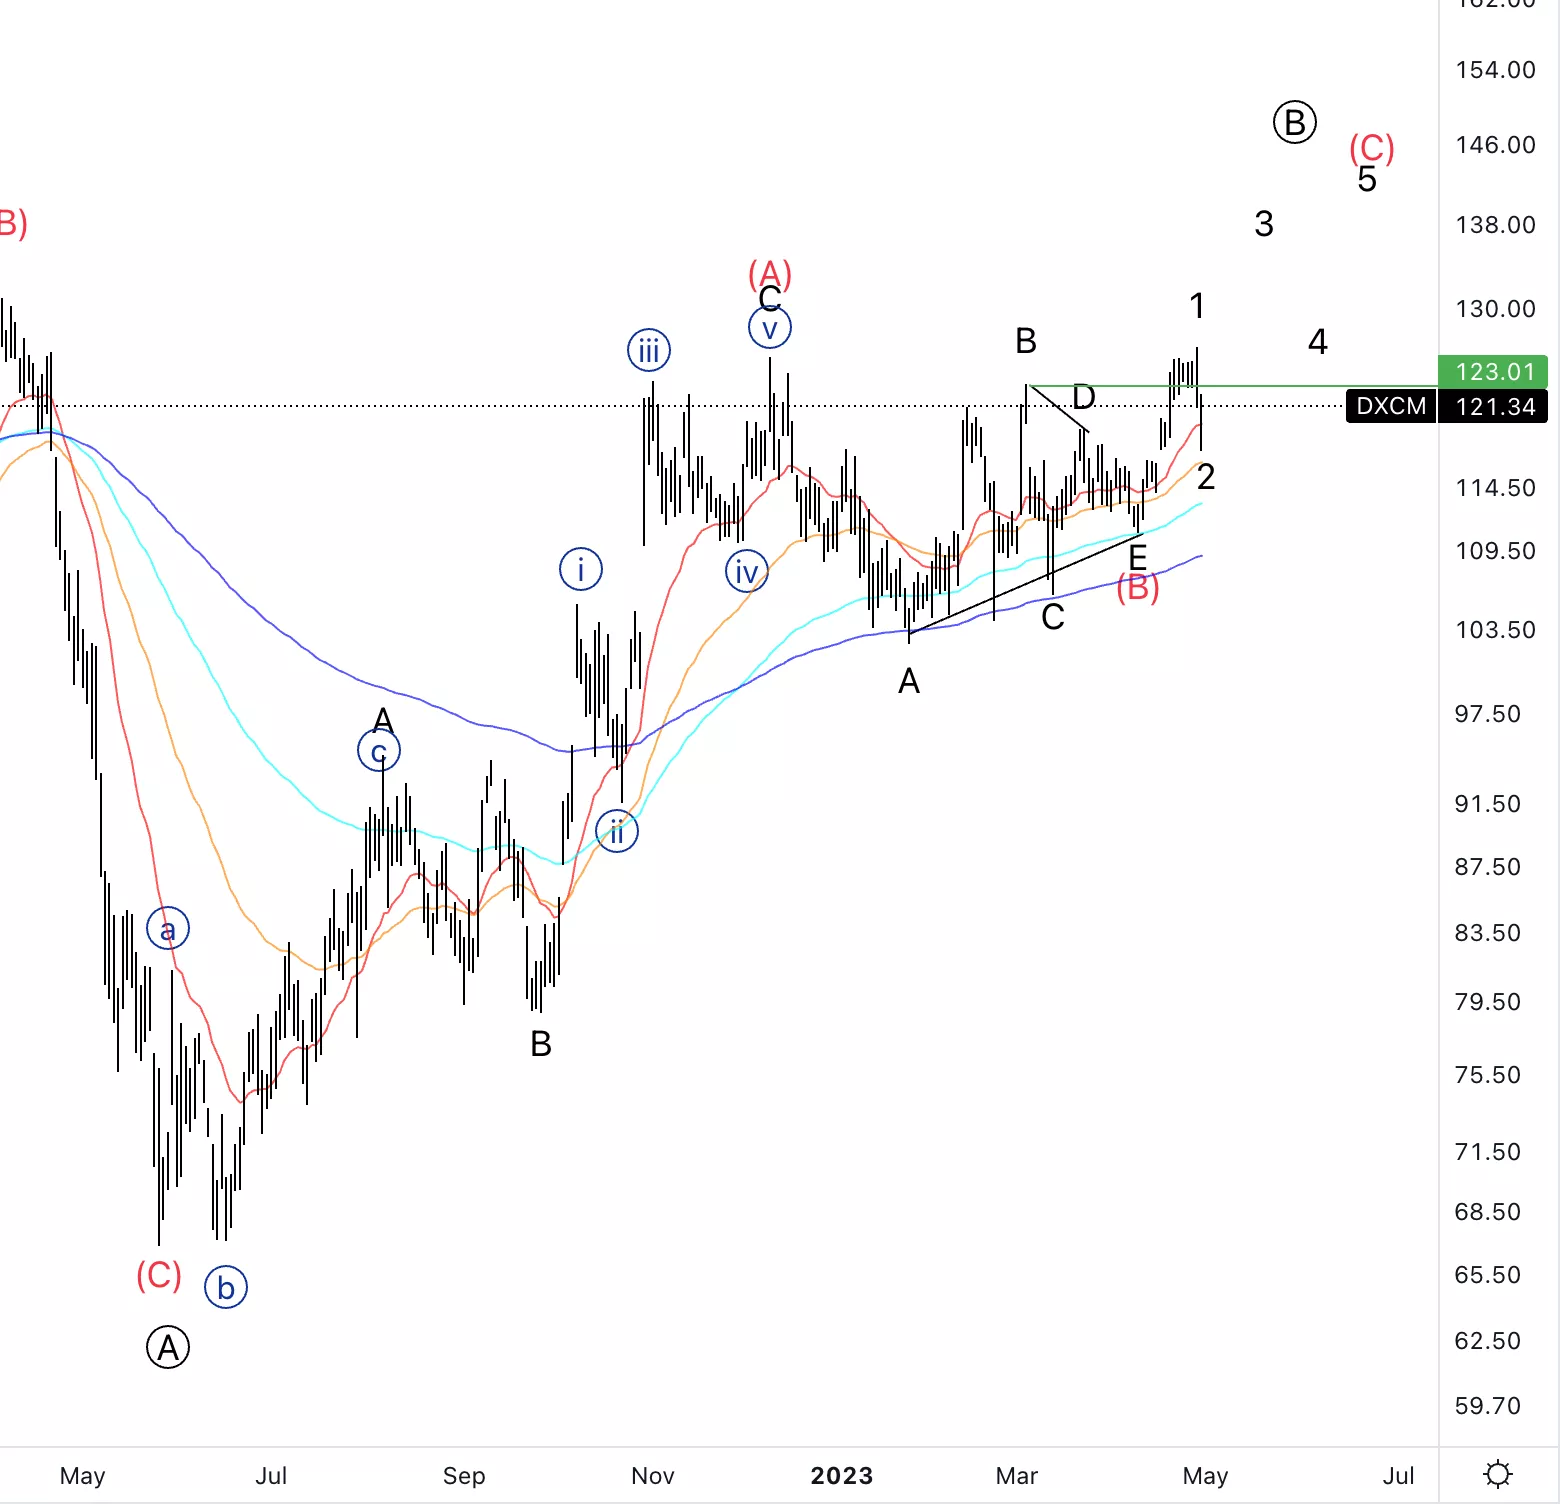
DexCom Inc., (DXCM): Daily Chart, May 1
DXCM Stock Market Analysis: We broke through confirmation by breaking the green line and we are pulling back as expected. Looking for further upside into wave 3.
DXCM Elliott Wave Count: Wave 2 of (C).
DXCM Technical Indicators: Above all averages.
DXCM Trading Strategy: Looking for a pullback into wave 2 to then look for longs.
TradingLounge Analyst: Alessio Barretta
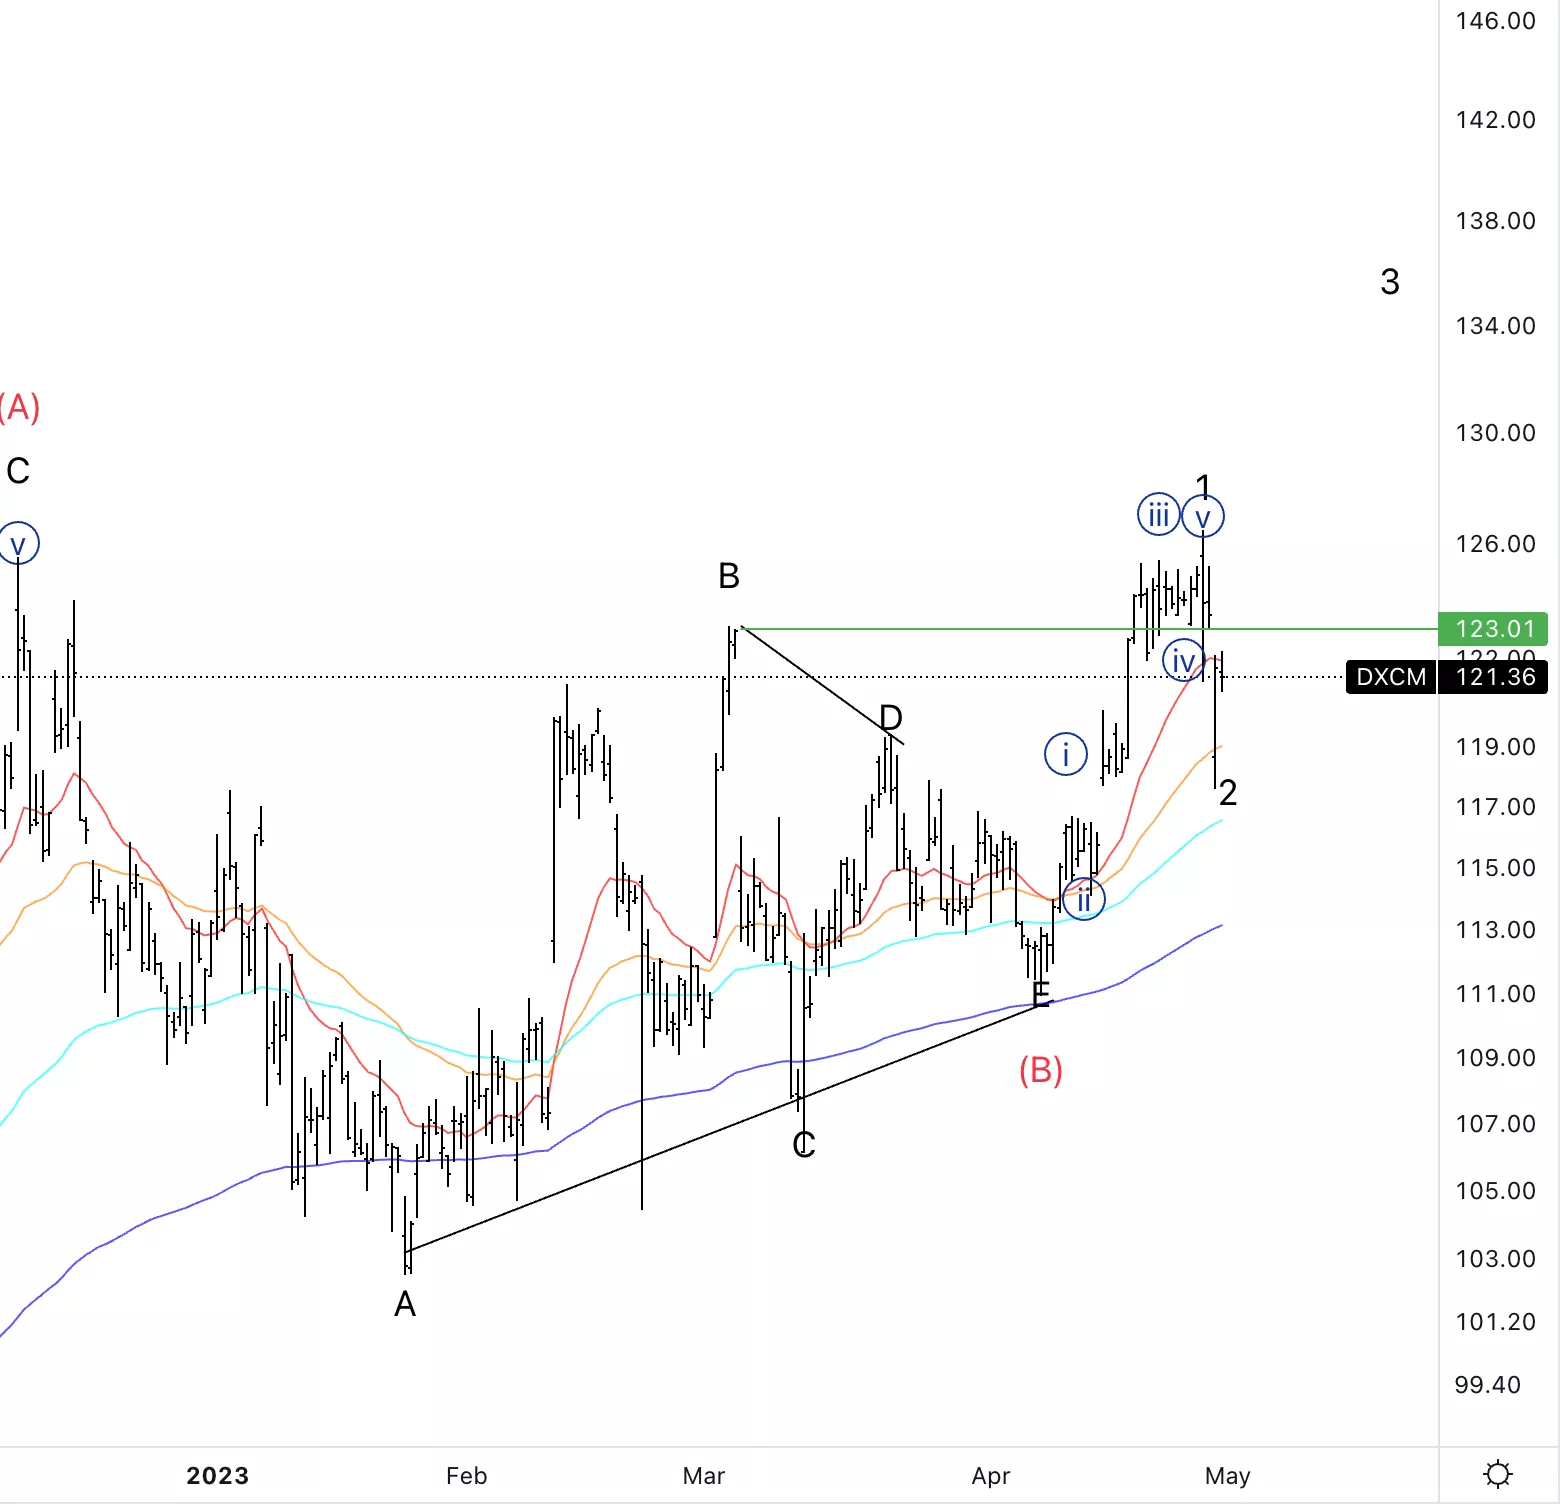
DexCom Inc., DXCM: 4-hour Chart, May 1
DexCom Inc., Elliott Wave Technical Analysis
DXCM Stock Market Analysis: By looking at the smaller timeframes it looks like we could have had a three wave move into wave 2 completed. We could start looking for longs with a stop at the end of wave E, allowing for a double correction lower into wave 2 of (C).
DXCM Elliott Wave count: Wave 2 of (C).
DXCM Technical Indicators: 20EMA as resistance.
DXCM Trading Strategy: Looking longs with a stop at the end of wave E.
More By This Author:
Elliott Wave Technical Analysis: Bitcoin, Monday, May 1
Elliott Wave Trading Strategies: SP500, Nasdaq, DowJones, Russell 2000
Elliott Wave Technical Analysis: United Parcel Service Inc. - Friday, April 28


Comments
Log in or sign up to join the conversation.