

Image Source: Unsplash
United Parcel Service Inc., Elliott Wave Technical Analysis
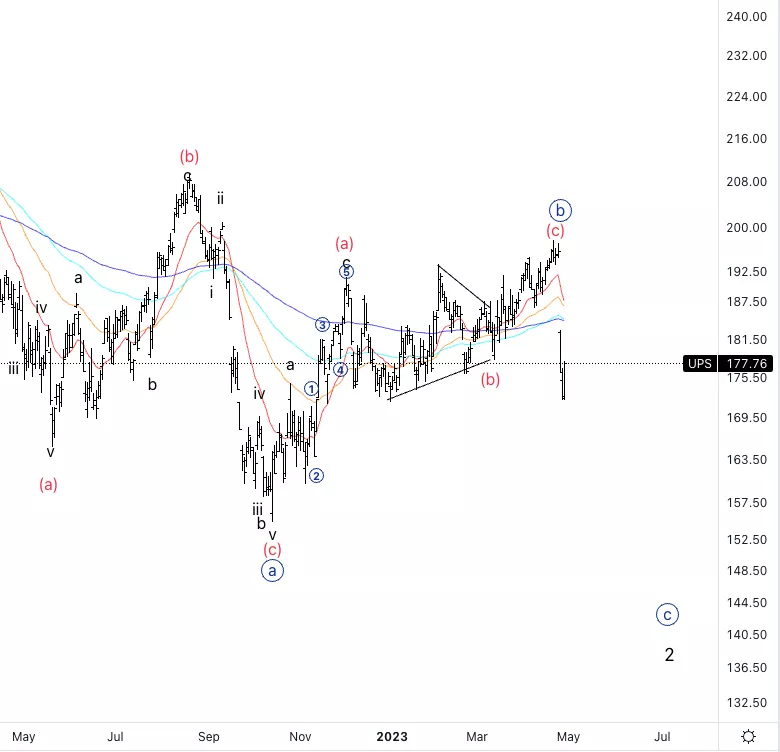
United Parcel Service Inc., (NYSE: UPS): Daily Chart, 28 April 2023.
UPS Stock Market Analysis: Looking for further downside into wave {c} as the upmove from October 2022 appears to be a three wave move therefore not trend-establishing.
UPS Elliott Wave Count: Wave {c} of 2.
UPS Technical Indicators: Below all averages.
UPS Trading Strategy: Looking for short into wave {c}, waiting for a pullback in wave (ii) before considering entries.
Analyst: Alessio Barretta
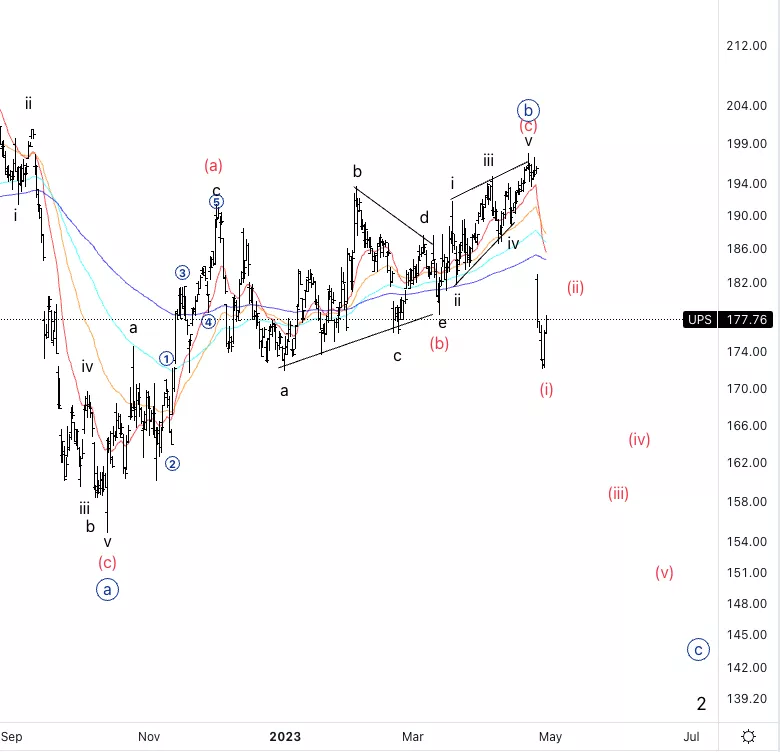
United Parcel Service Inc., UPS: 4-hour Chart, 28 April 2023.
United Parcel Service Inc., Elliott Wave Technical Analysis
UPS Stock Market Analysis: It looks like we are pulling back into wave (ii). Looking for further downside to complete the overall correction in wave 2.
UPS Elliott Wave count: Wave (ii) of {c}.
UPS Technical Indicators: Below all averages.
UPS Trading Strategy: Looking for short into wave {c}, waiting for a pullback in wave (ii) before considering entries.
More By This Author:
Technical Analysis: Commodity Futures Market
U.S. Stock Market - Elliott Wave
Elliott Wave Technical Analysis: Texas Instruments, Apr. 27


Comments
Log in or sign up to join the conversation.