
Texas Instruments Inc., Elliott Wave Technical Analysis

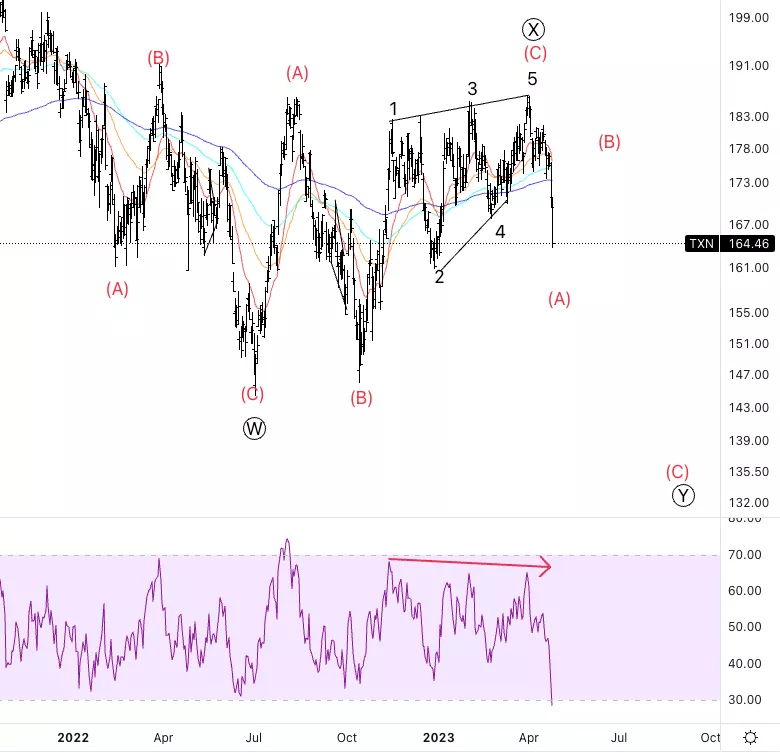
Texas Instruments Inc., (TXN): Daily Chart, April 27
TXN Stock Market Analysis: After we got stopped out at breakeven in our trade, I reviewed the whole count and I am allowing for much more downside. Looking for the move in wave (A) to complete within the end of the month to then look for a pullback in wave (B).
TXN Elliott Wave Count: Wave (A) of Y.
TXN Technical Indicators: Below all averages, RSI bearish divergence.
TXN Trading Strategy: Looking for short before wave (A) end to then look for additional shorts at the end of wave (B).
TradingLounge Analyst: Alessio Barretta
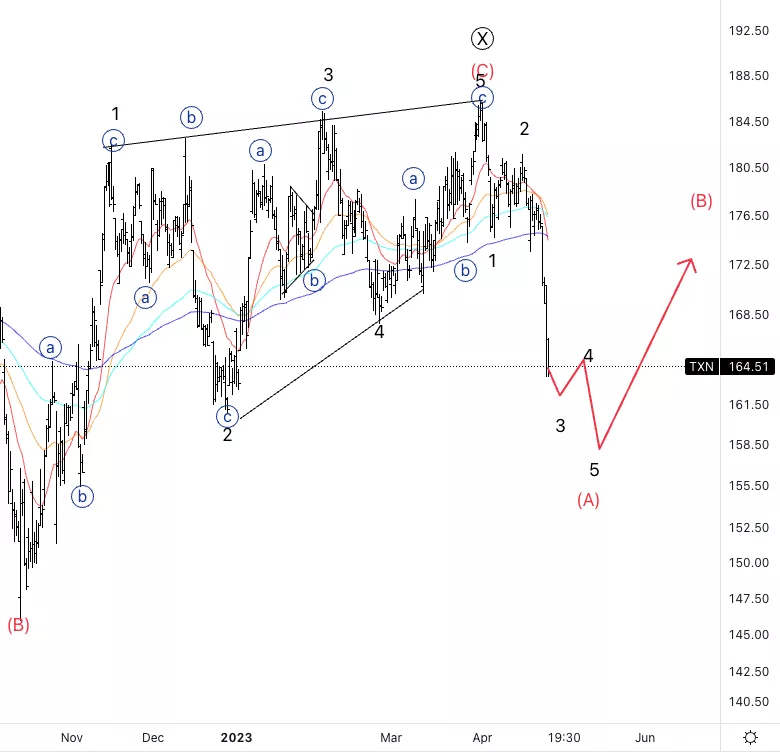
Texas Instruments Inc., TXN: 4-hour Chart, April 27.
Texas Instruments Inc., Elliott Wave Technical Analysis
TXN Stock Market Analysis: Looking for more downside as labelled, we could start to form a series of threes and fours which should be shorting opportunities.
TXN Elliott Wave count: Wave 3 of (A).
TXN Technical Indicators: Below all averages.
TXN Trading Strategy: Looking for additional downside.
More By This Author:
Elliott Wave Technical Analysis: Binance/U.S. Dollar - Thursday, April 27
Elliott Wave Technical Analysis: Cintas Corp. - Wednesday, April 26
Elliott Wave Technical Analysis: Theta Token/U.S. Dollar


Comments
Log in or sign up to join the conversation.