


Image Source: Pixabay
DexCom Inc., Elliott Wave Technical Analysis
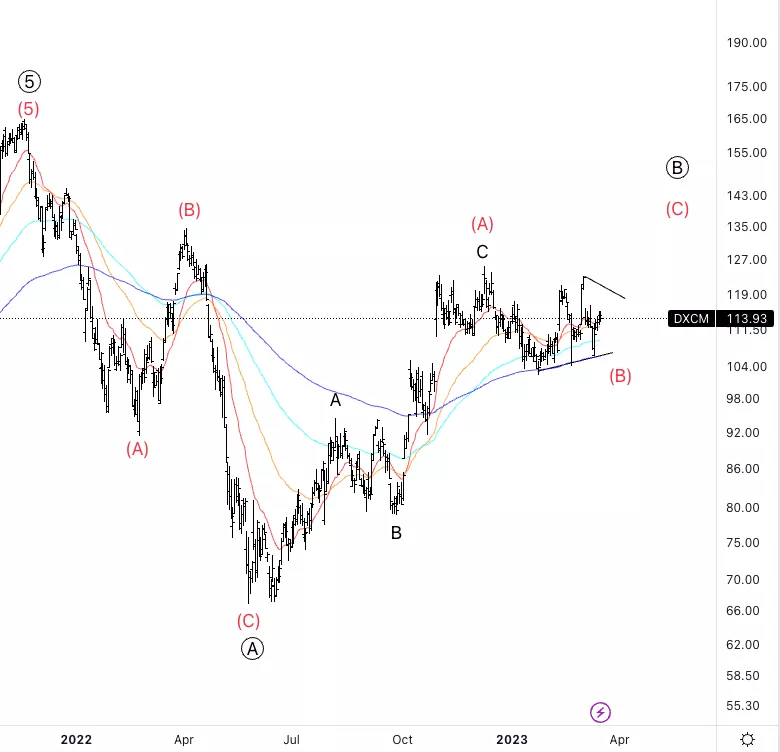
DexCom Inc., (Nasdaq: DXCM): Daily Chart, 20 March 2023.
DXCM Stock Market Analysis: Looking for an overall long-term correction to take place as we could be correcting the entire up move from 2008.Looking for another leg higher before potential downside resumption.
DXCM Elliott Wave Count: Wave (B) of B.
DXCM Technical Indicators: Above all averages.
DXCM Trading Strategy: We could look for longs with a stop below 104$.
Analyst: Alessio Barretta
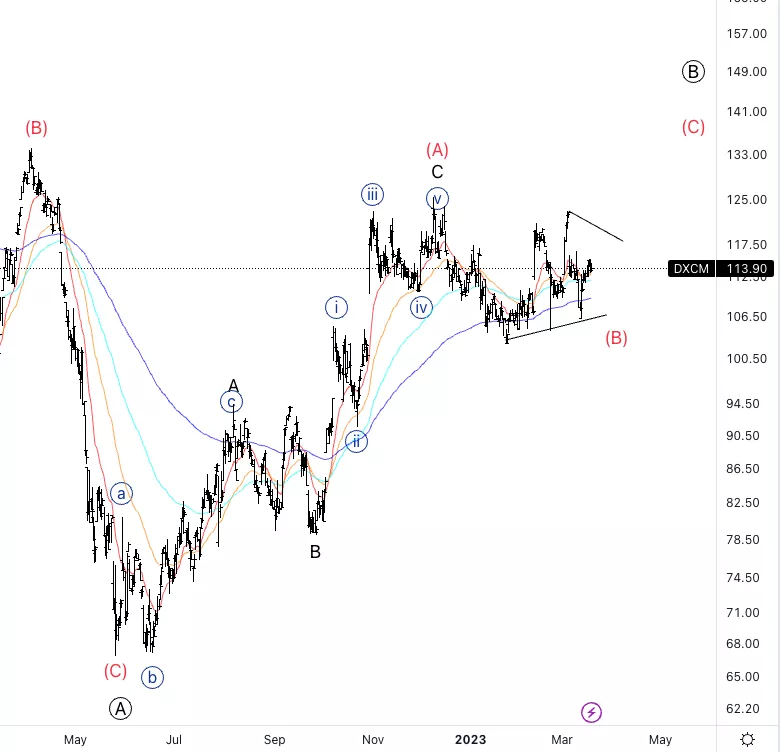
DexCom Inc., DXCM: 4-hour Chart, 20 March 2023.
DexCom Inc., Elliott Wave Technical Analysis
DXCM Stock Market Analysis: Here the three wave move to the upside appears clearer. Looking for sideway continuation as long as we stay above the 200EMA to then resume higher.
DXCM Elliott Wave count: Wave (B) of B.
DXCM Technical Indicators: In between averages.
DXCM Trading Strategy: Looking for sideways continuation in wave (B).Enterwave (B).
More By This Author:
ASX200 Summary, Nasdaq Stocks, Metals - Elliott Wave Analysis
Elliott Wave Technical Analysis: Shopify Inc. - Friday, March 17
Elliott Wave Technical Analysis: Binance Coin / U.S. Dollar



Comments
Log in or sign up to join the conversation.