

Deere & Co., Elliott Wave Technical Analysis

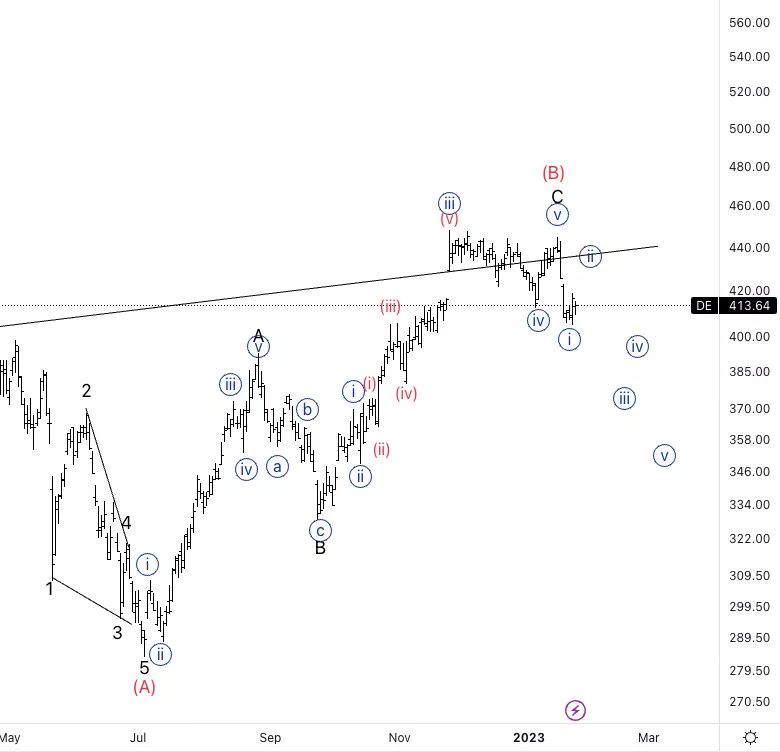
Deere & Co.,(DE): Daily Chart, January 26, 2023
DE Stock Market Analysis: As we mentioned last week, it looks like we have a top in place for wave (B) and we are set to resume lower, or at least we seem to be facing a large retracement.
DE Elliott Wave Count: Wave{i} of1.
DE Technical Indicators: Below the 20EMA.
DE Trading Strategy: Looking for a pullback in wave {ii} to then enter shorts.
TradingLounge Analyst: Alessio Barretta
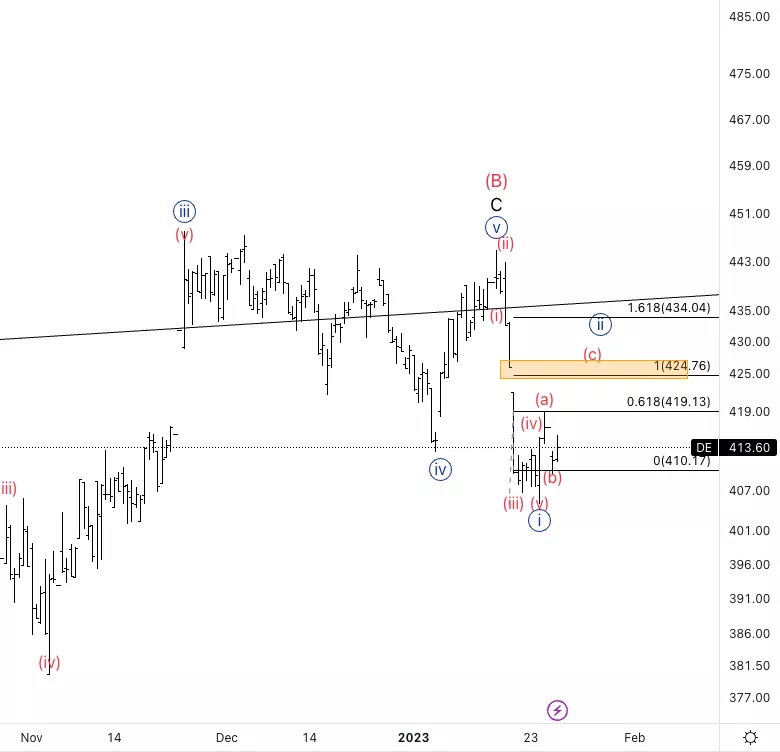
Deere & Co., DE: 4-hour Chart, 26 January 23,
Deere & Co., Elliott Wave Technical Analysis DE Stock Market Analysis: It looks like we have a clear five wave move in wave {i} which sets us up for athree wave pullback. The highlighted area represent the gap on the left to be filled, which is also at equality of (a) vs. (c).
DE Elliott Wave count: Wave (b) of {ii}.
DE Technical Indicators: support on the 200EMA
DE Trading Strategy: Waiting for wave (c) to then enter short.
More By This Author:
Elliott Wave Investing Strategies: DAX 40, FTSE 100, DXY, GBPUSD, EURUSD
Elliott Wave Technical Analysis: United Parcel Service Inc. - Wednesday, Jan. 25
Elliott Wave Technical Analysis: Binance / U.S. Dollar - Wednesday, Jan. 25



Comments
Log in or sign up to join the conversation.