

Image Source: Unsplash
United Parcel Service Inc., Elliott Wave Technical Analysis
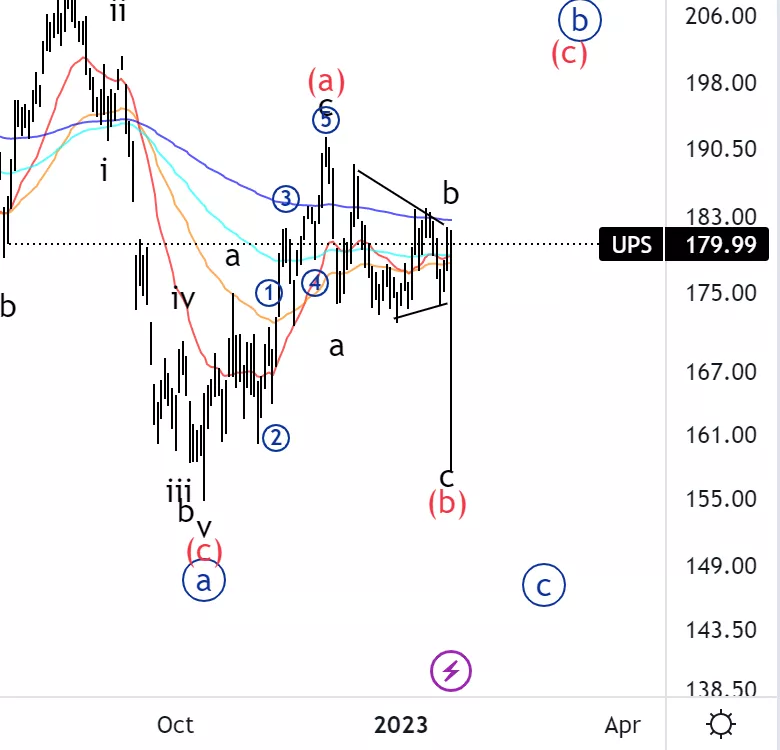
United Parcel Service Inc., (NYSE: UPS): Daily Chart, 25 January 23,
UPS Stock Market Analysis: The big dump on the daily chart isn’t actually real, therefore everything is moving as expected and we are actually expecting a downside into wave c of (b).
UPS Elliott Wave Count: Wave(b) of{b}.
UPS Technical Indicators: 200EMA acting as resistance
UPS Trading Strategy: We can look for shorts right now with a stop above wave a of the triangle represented by the red line.
Analyst: Alessio Barretta
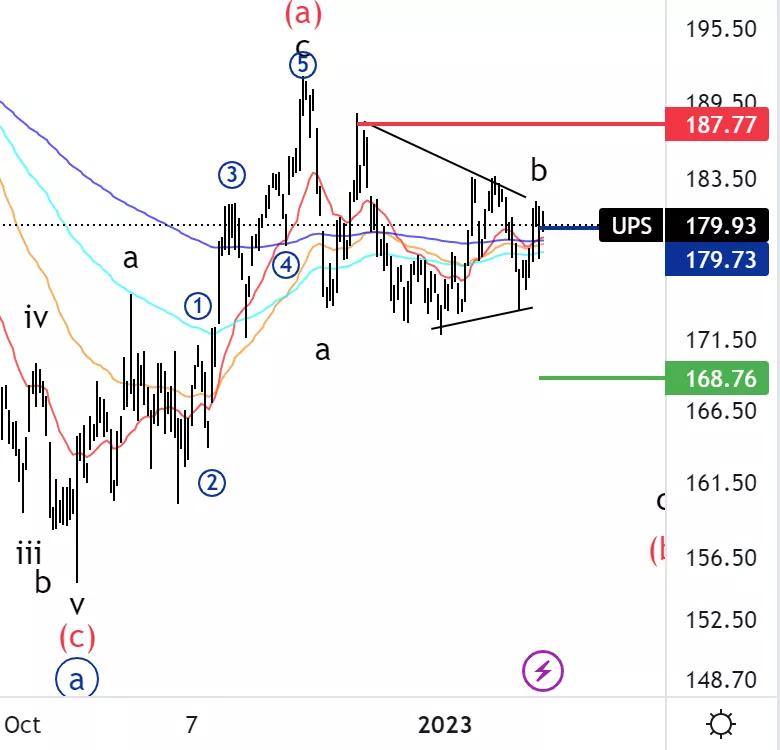
United Parcel Service Inc., UPS: 4-hour Chart, 25 January 2023
United Parcel ServiceInc., Elliott Wave Technical AnalysisUPS Stock Market Analysis: It looks like we are in wave e of the triangle in wave b. Looking for a downside.
UPS Elliott Wave count: Wave of b.
UPS Technical Indicators: averages acting as resistance
UPS Trading Strategy: Looking for shorts with stop and entry point represented by the red and blue lines.
More By This Author:
Elliott Wave Technical Analysis: Binance / U.S. Dollar - Wednesday, Jan. 25
S&P 500, Nasdaq-100, RUT, DJI: Elliott Wave Investing
Elliott Wave Technical Analysis: AAVE / U.S. Dollar


Comments
Log in or sign up to join the conversation.