

Image Source: Unsplash
CSX Corp., Elliott Wave Technical Analysis
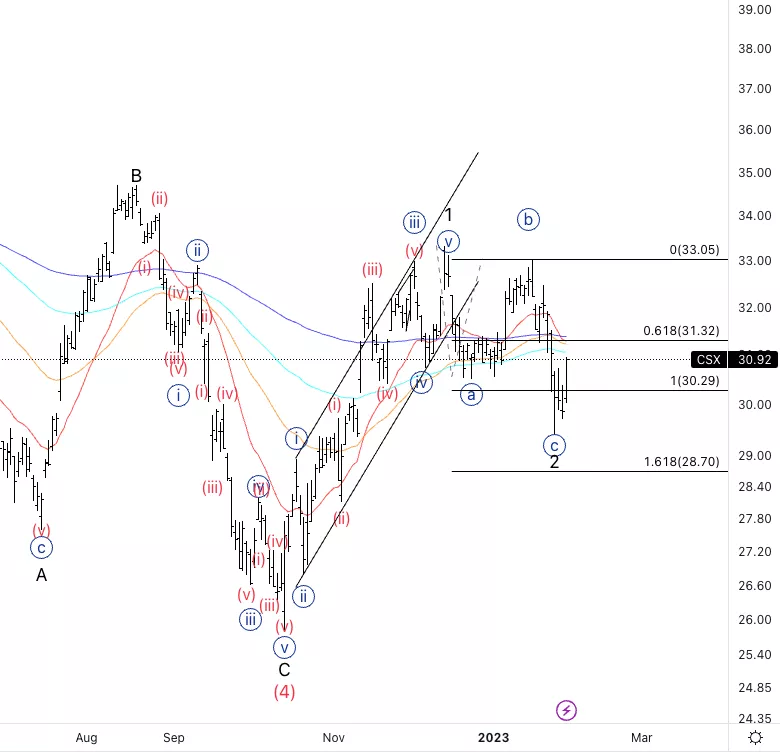
CSX Corp., (Nasdaq: CSX): Daily Chart, 1 February 2023,
CSX Stock Market Analysis: I slightly changed the count anticipating the bottom of wave 2. We reacted off the equality of C vs. A as we move back higher into the averages.
CSX Elliott Wave Count: Wave {c} of 2.
CSX Technical Indicators: Below all averages
CSX Trading Strategy: Looking for a break of {b} to start looking for longs.
Analyst: Alessio Barretta
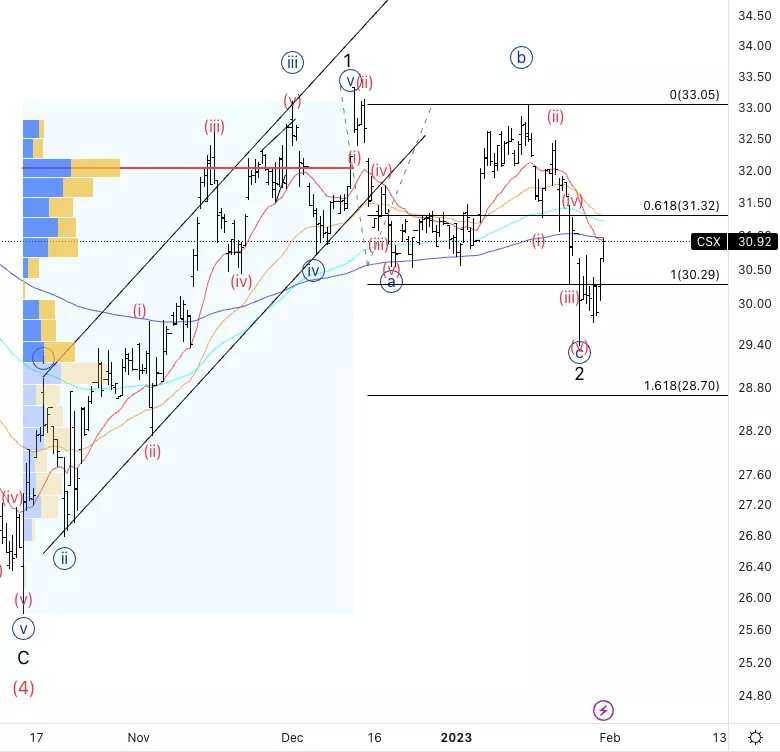
CSX Corp., CSX: 4-hour Chart, 1 February 23,
CSX Corp., Elliott Wave Technical Analysis
CSX Stock Market Analysis: The count for wave {c} has been a little challenging. The best idea is an expanding diagonal in wave {c}.
CSX Elliott Wave count: Wave i of (i).
CSX Technical Indicators: Cross of 20 and 200EMA.
CSX Trading Strategy: Looking for confirmation to then build longs after a clear five wave move to the upside.
More By This Author:
Elliott Wave Technical Analysis: Ethereum / U.S. Dollar
Elliott Wave Technical Analysis: Block Inc.
Elliott Wave Technical Analysis: Bitcoin / U.S. Dollar, Jan. 31


Comments
Log in or sign up to join the conversation.