

Photo by Joshua Mayo on Unsplash
CSX Corp., Elliott Wave Technical Analysis
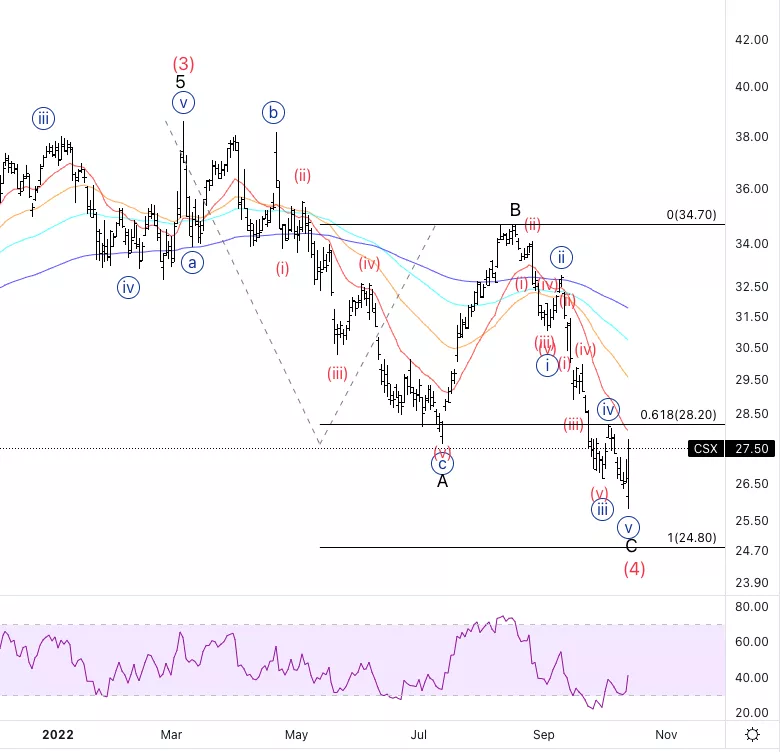
CSX Corp., (Nasdaq: CSX): Daily Chart, October 14, 2022,
CSX Stock Market Analysis: At this point, we can see a five-wave move potentially completed, which could signify the end of higher degree C and therefore the whole correction into wave (4).
CSX Elliott Wave count: C of (4).
CSX Technical Indicators: Below all EMAs but this RSI bullish divergence.
CSX Trading Strategy: Looking for further confirmation to be followed by a clear five-wave move to the upside.
Analyst: Alessio Barretta
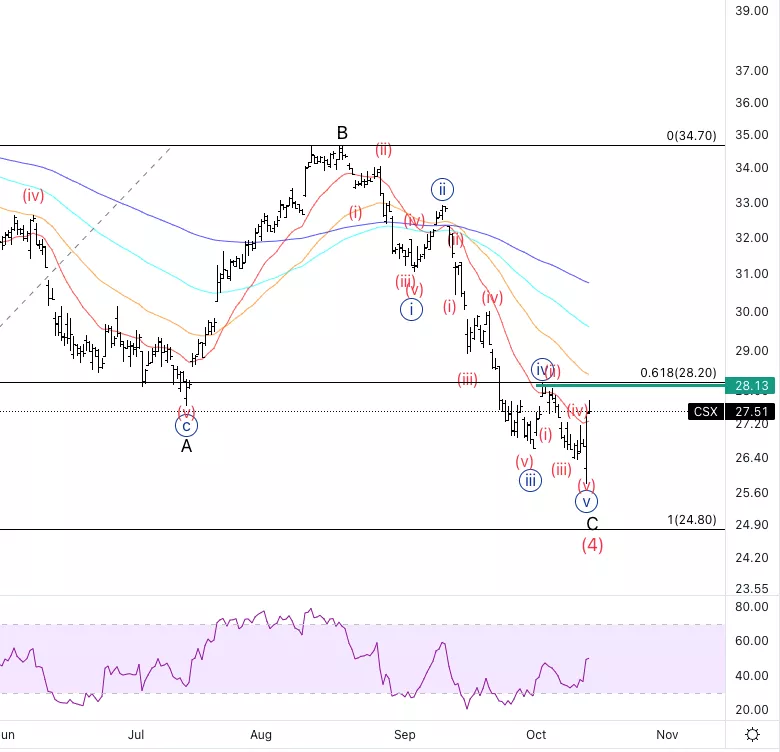
CSX Corp., CSX: 4-hour Chart, October 14, 2022
CSX Corp., Elliott Wave Technical Analysis
CSX Stock Market Analysis: We can see how w have had five wave into wave {v}, which means we could have completed a higher degree C.
CSX Elliott Wave count: {v} of C.
CSX Technical Indicators: We broke through the 20EMA(red line).
CSX Trading Strategy: Looking for a break of the green line for additional confirmation and perhaps support off the 20EMA.
More By This Author:
Elliott Wave Technical Analysis: Uniswap - Friday, Oct. 14
SP500 Elliott Wave Analysis - Bear Market Corrective Rally
Elliott Wave Technical Analysis: Biogen, Inc. - Thursday, Oct. 13


Comments
Log in or sign up to join the conversation.