
Biogen Inc., Elliott Wave Technical Analysis

Image: Biogen
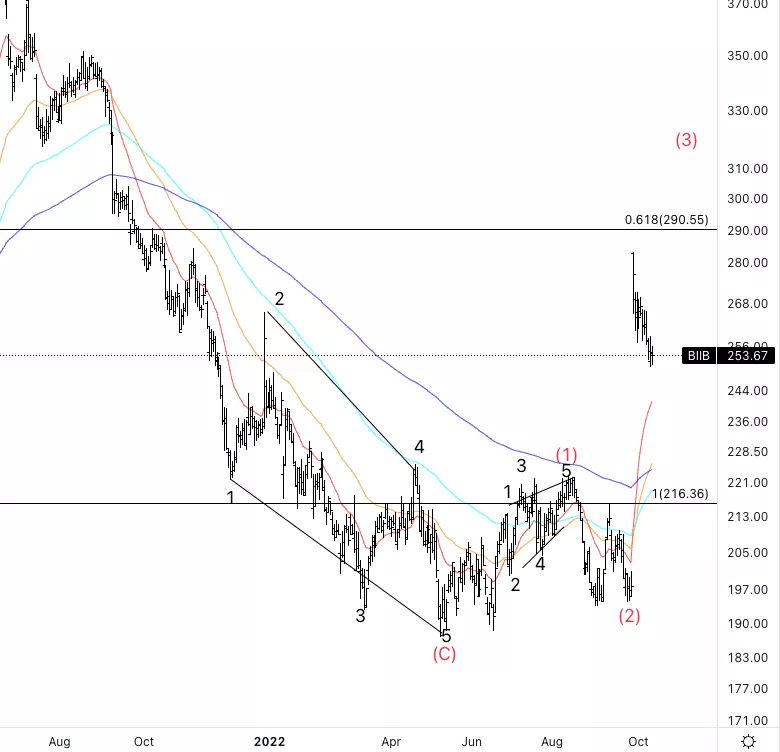
Biogen Inc., (BIIB): Daily Chart, October 13 2022,
BIIB Stock Market Analysis: Moving as predicted, Looking for this pullback to this support as we have had a huge gap to the upside.
BIIB Elliott Wave count: 2 of (3).
BIIB Technical Indicators: We broke through all averages.
BIIB Trading Strategy: Looking for long on this last pullback, as soon as we can identify a five wave move on shorter timeframes.
TradingLounge Analyst: Alessio Barretta
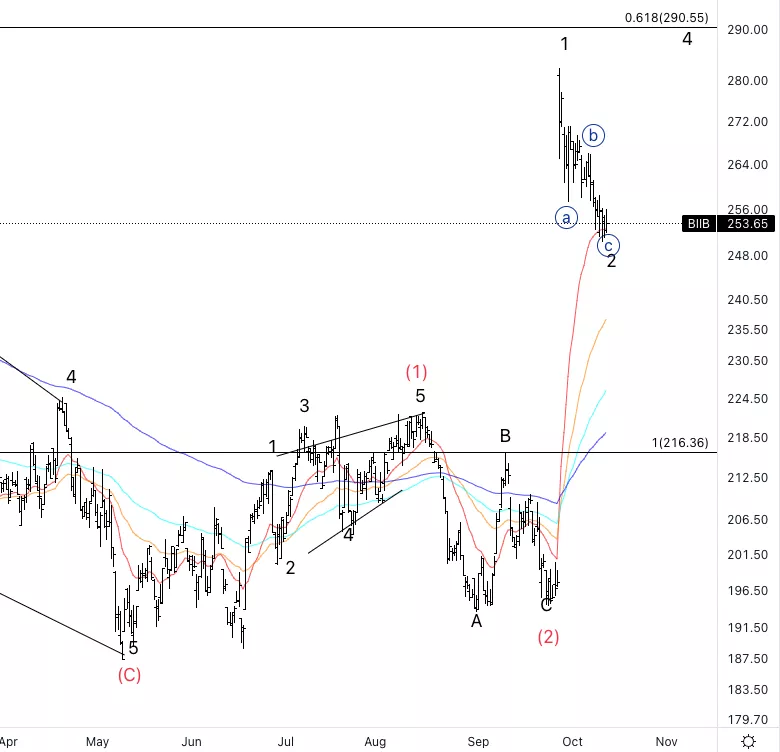
Biogen Inc., BIIB: 4-hour Chart, October 13 2022
Biogen Inc., Elliott Wave Technical Analysis
BIIB Stock Market Analysis: Looking for this wave 2 to come to an end soon as we have approached the 20EMA and it is currently acting as support.
BIIB Elliott Wave count: {c} of 2.
BIIB Technical Indicators: 20 EMA acting as support.
BIIB Trading Strategy:Looking for a break of wave {B} at 265$ to have further confirmation for longs.
More By This Author:
Elliott Wave Technical Analysis: Ripple, Thursday, Oct. 13
DAX 40 Index Chart And Forecasts
Elliott Wave Technical Analysis: PepsiCo Inc.


Comments
Log in or sign up to join the conversation.