
Pepsico Inc., Elliott Wave Technical Analysis
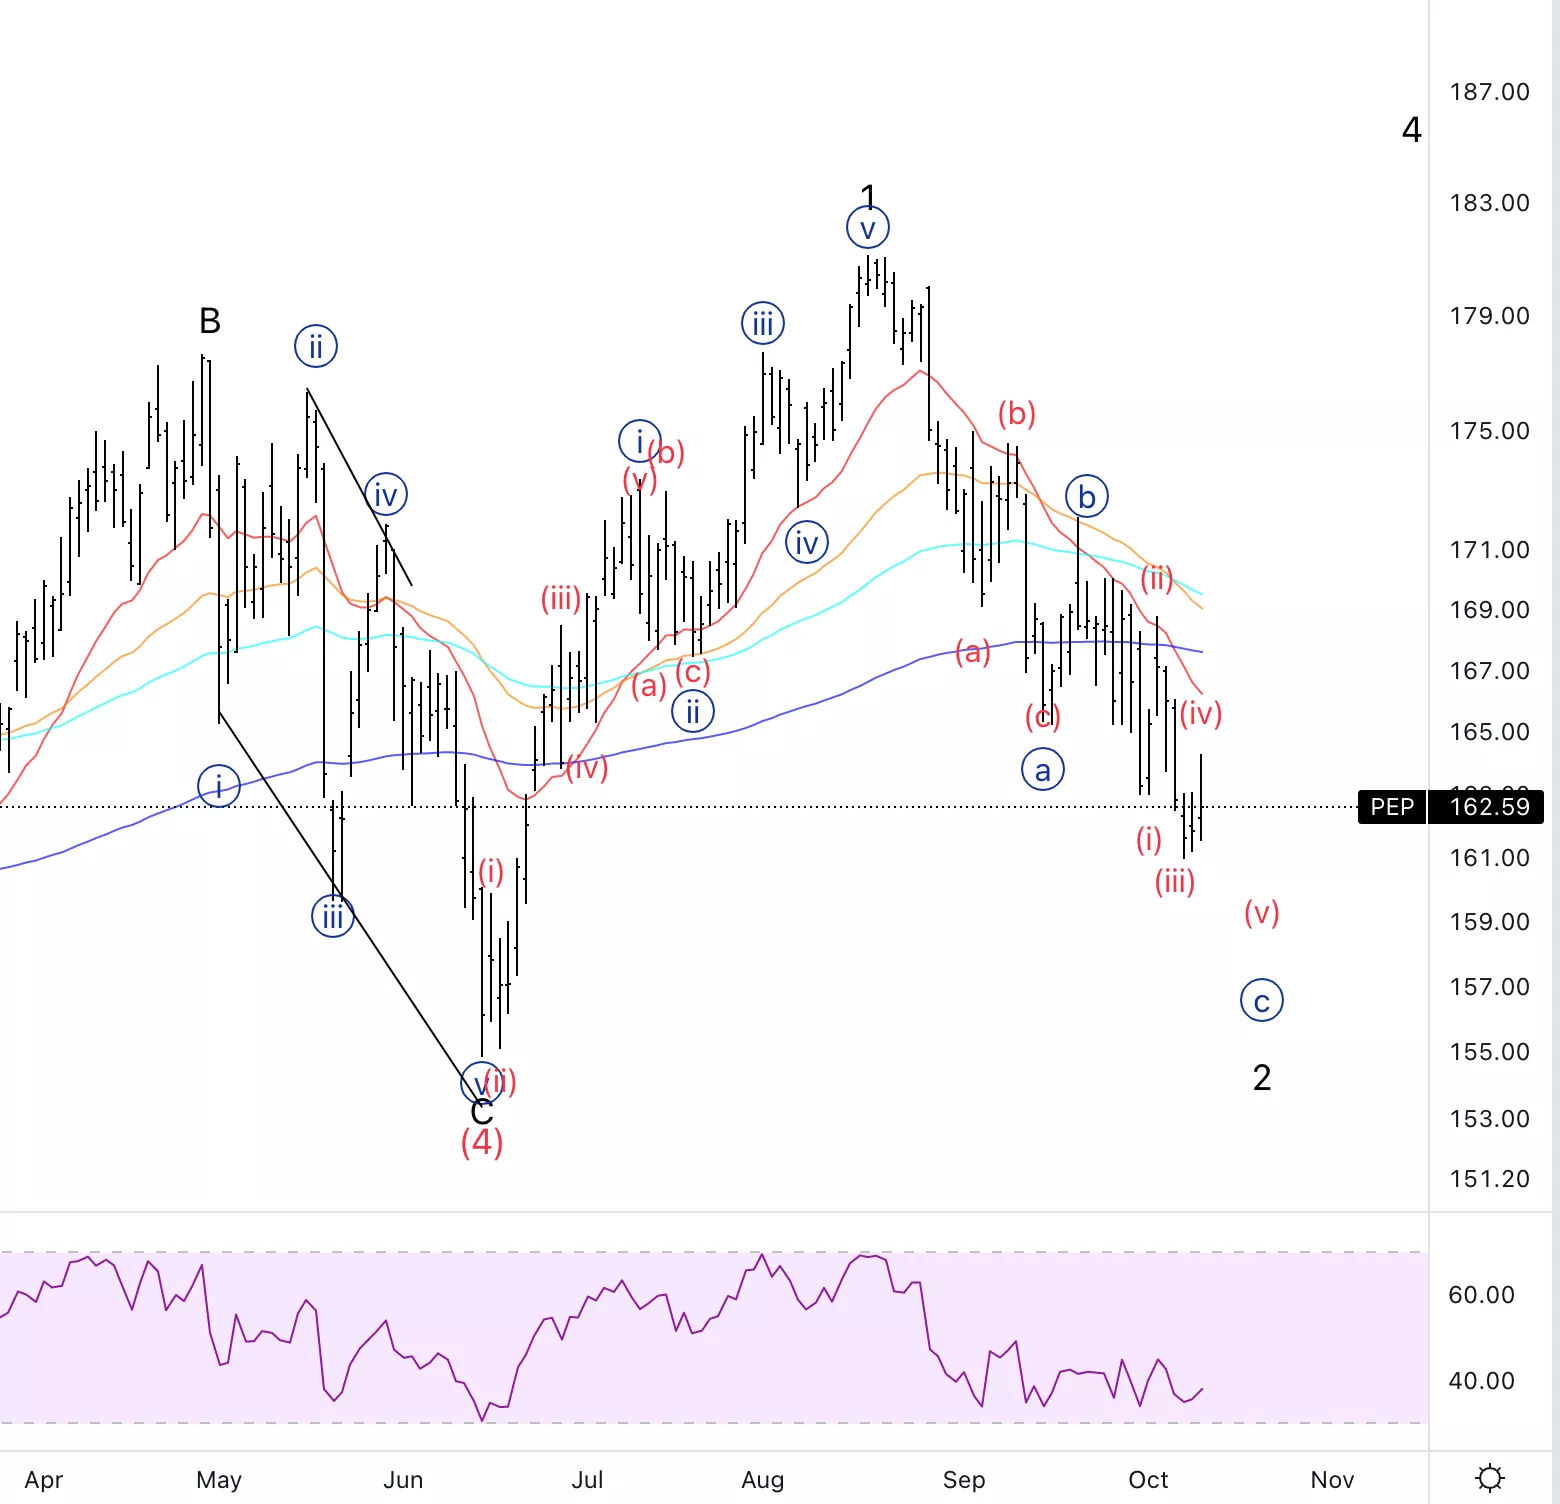
Pepsico Inc., (Nasdaq: PEP): Daily Chart, October 12, 2022,
PEP Stock Market Analysis: We are moving lower in an overlapping structure which usually signifies the trend is weakening.
PEP Elliott Wave count: {c} of 2
PEP Technical Indicators: We are starting to form RSI bullish divergence.
PEP Trading Strategy: We can take short term shorts, and wait for the large move-up we are anticipating.
Analyst: Alessio Barretta
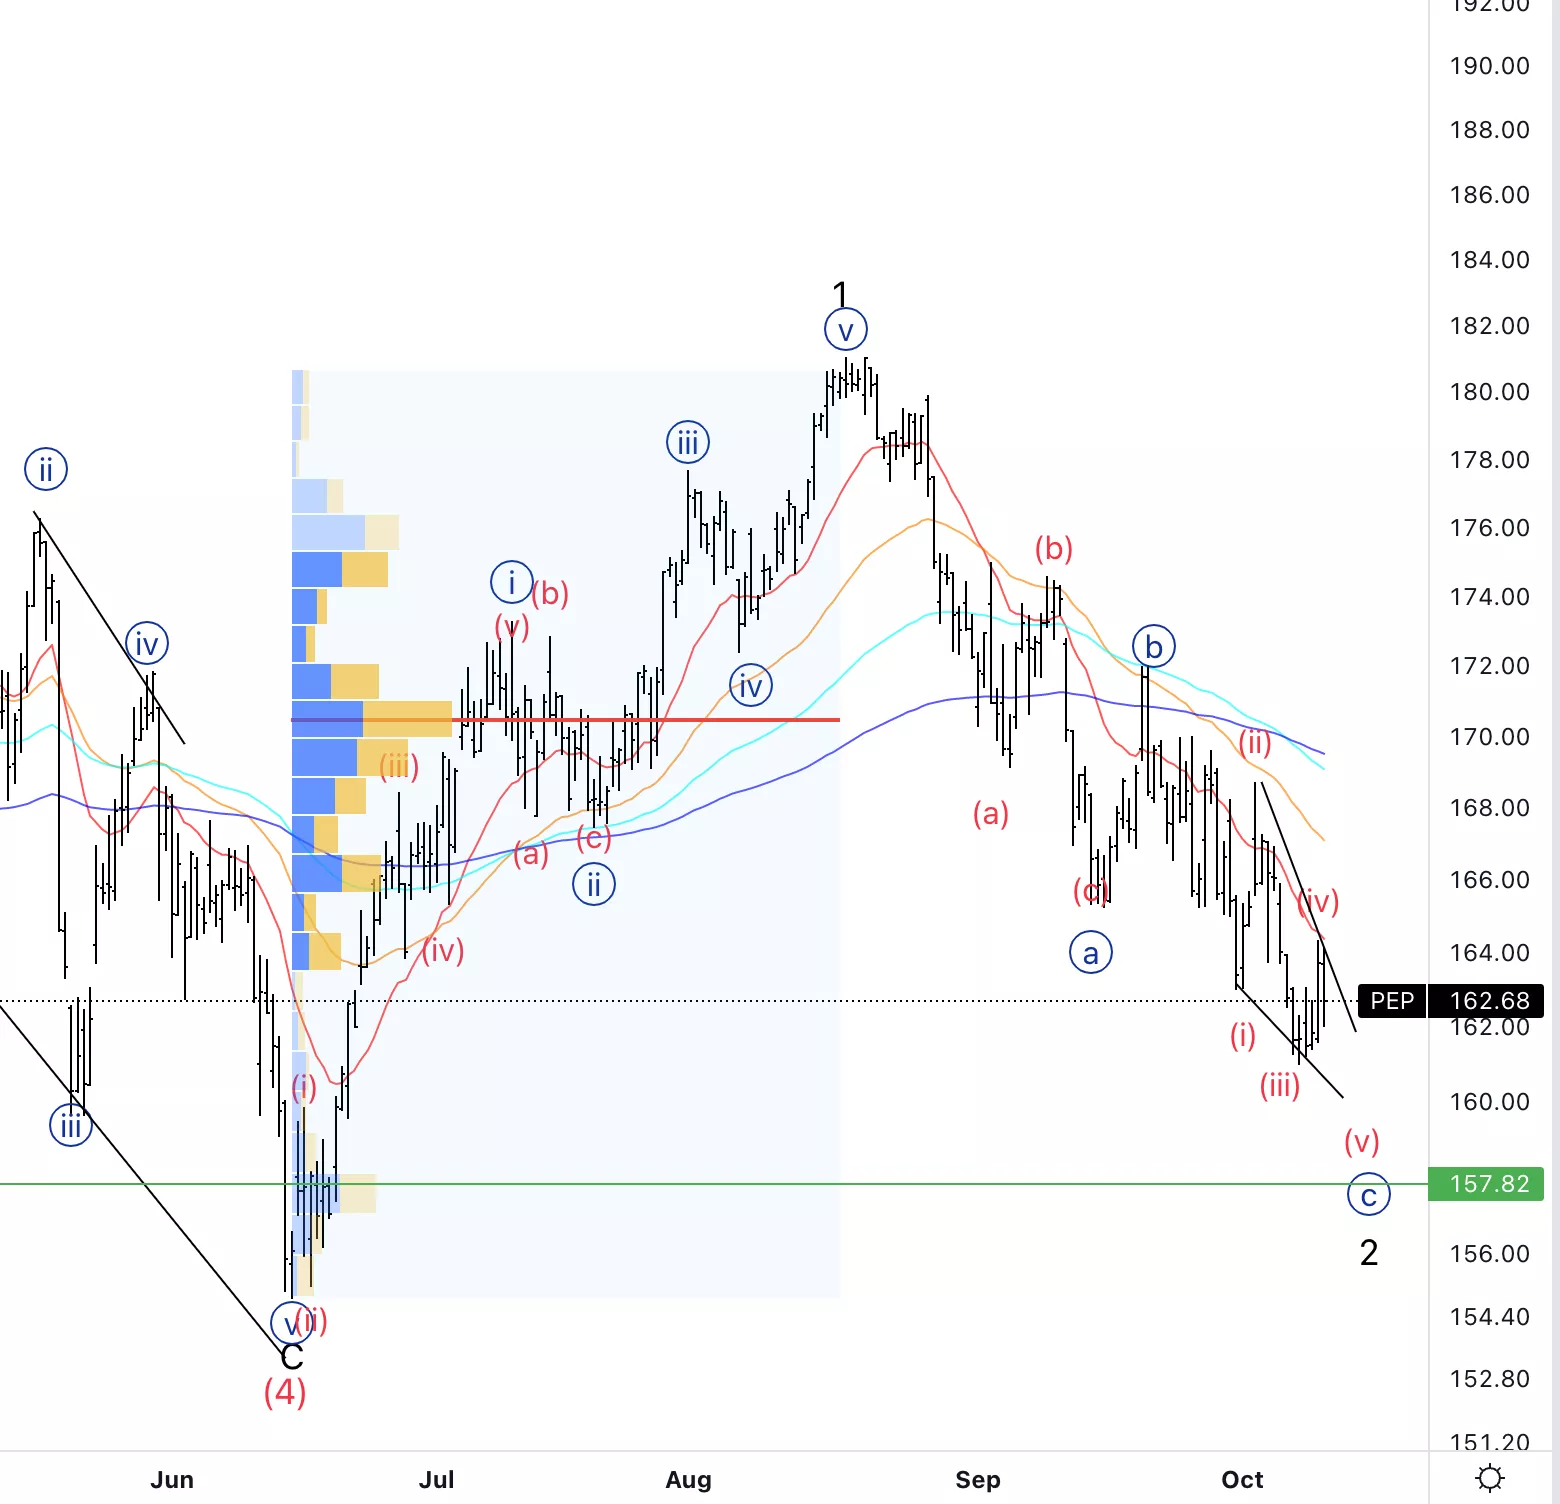
Pepsico Inc., PEP: 4-hour Chart, October 12, 2022
Pepsico Inc., Elliott Wave Technical Analysis
PEP Stock Market Analysis: Potential ending diagonal forming in wave {c} as we approach the second largest volume point where the green line is.
PEP Elliott Wave count: {c} of 2.
PEP Technical Indicators: Below all averages, 20 EMA acting as resistance.
PEP Trading Strategy: In the following session I will expect further downside as long as we do not break the top of wave (iv) at 164$.
More By This Author:
Chainlink(LINKUSD) Elliott Wave Technical Analysis 12 October 2022
SP500 Elliott Wave Analysis Wave Ii) For Short Trades
Bitcoin Elliott Wave: A Rally, Then Down Into Wave Iii


Comments
Log in or sign up to join the conversation.