
Costco Wholesale Corp., Elliott Wave Technical Analysis

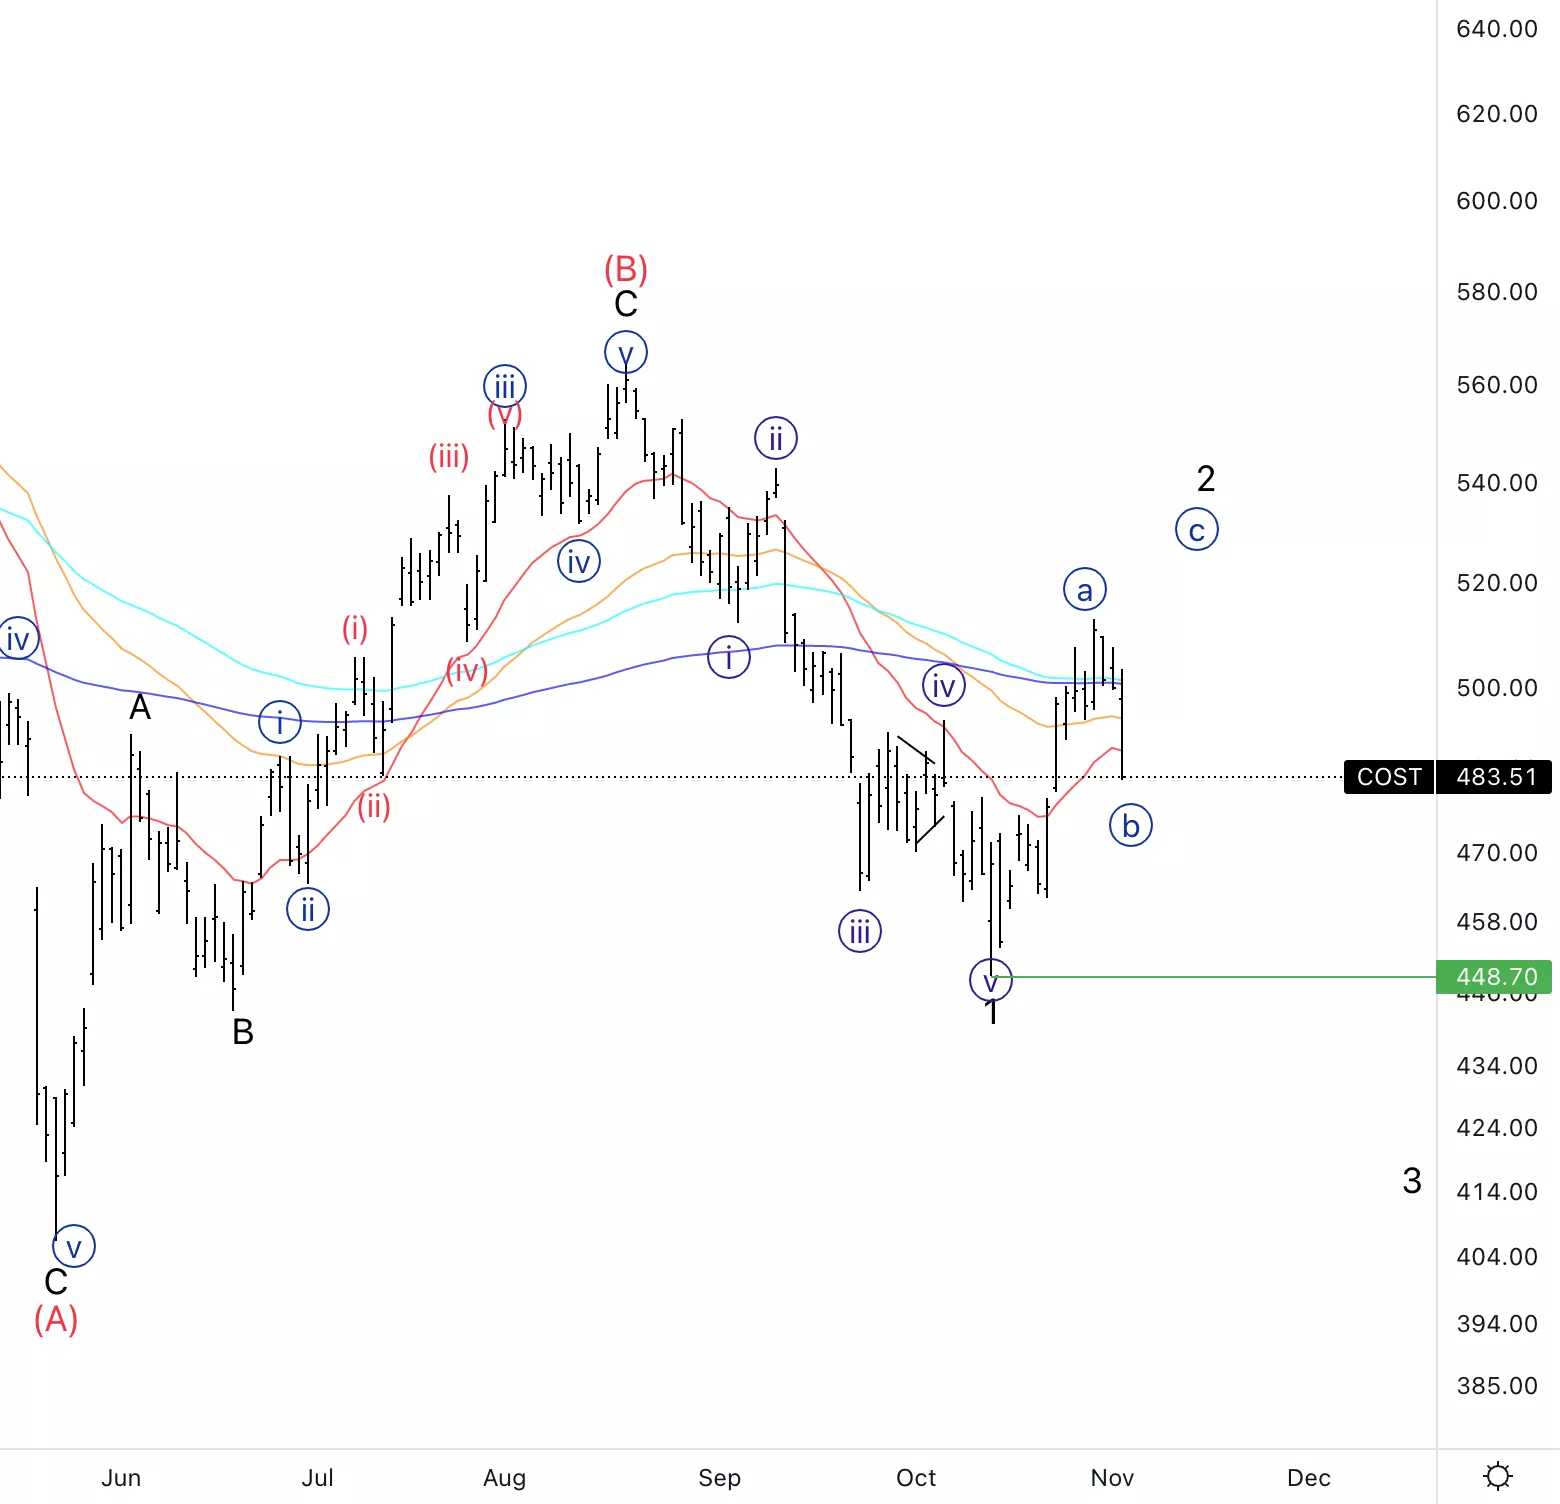
Costco Wholesale Corp., (COST): Daily Chart, November 3 2022,
COST Stock Market Analysis: Moving lower as predicted in the last forecast. We will have to find out whether we are already into an impulsive move such as in wave 3 or else we are still correcting wave 2.
COST Elliott Wave Count: Wave {b} of 2.
COST Technical Indicators: Reacted from the 200EMA.
COST Trading Strategy: Waiting for an upside move if we will eventually develop into a wave{c} or else if we break the green line we can start looking for shorts.
TradingLounge Analyst: Alessio Barretta
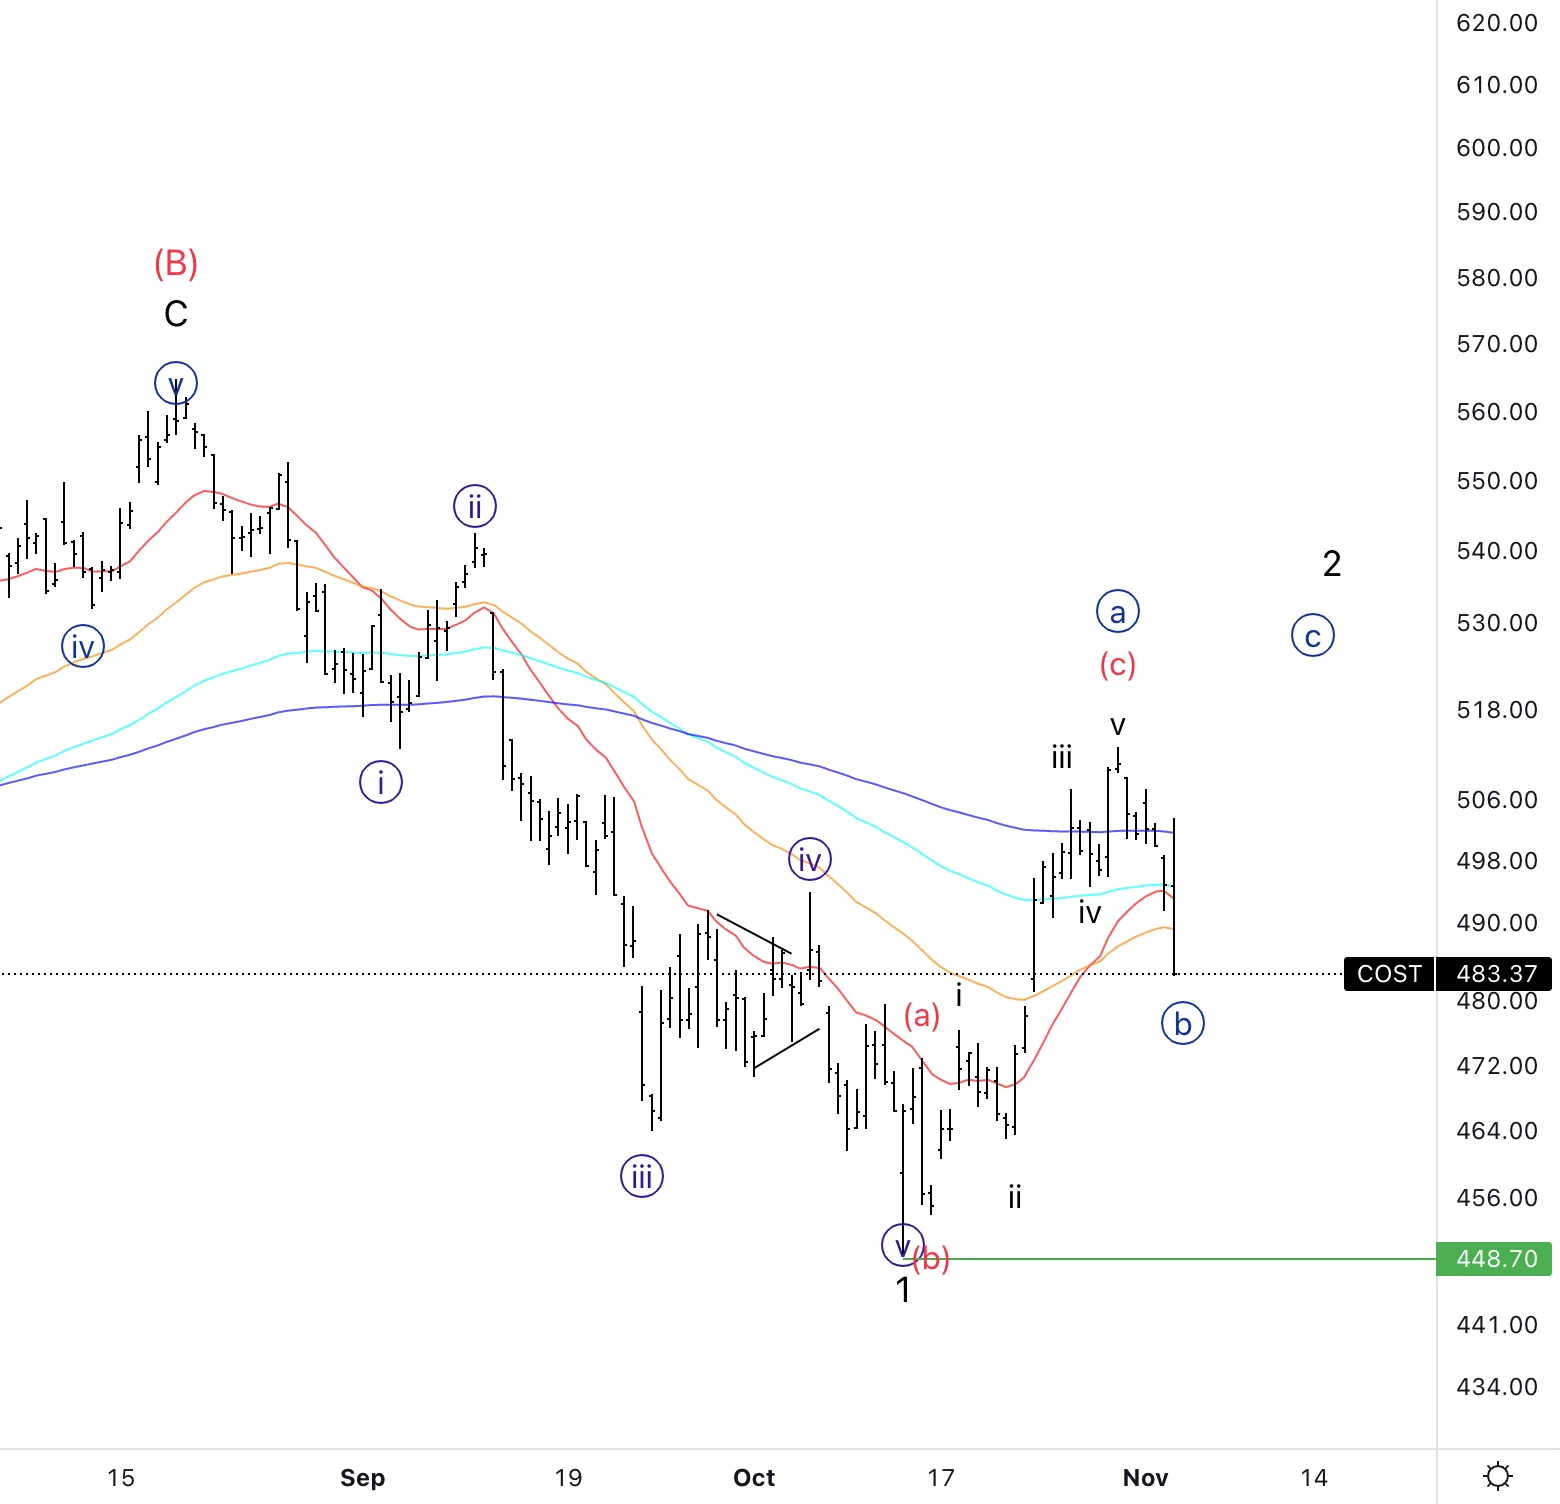
Costco Wholesale Corp., COST: 4-hour Chart, November 3 2022
Costco Wholesale Corp., Elliott Wave Technical Analysis
COST Stock Market Analysis: It is pretty clear that the move up in wave {a} was a three wave move as shown.
COST Elliott Wave count: Wave (c) of {b}.
COST Technical Indicators: Below all EMAs.
COST Trading Strategy: Waiting for further developments, we will most likely get some kind of support within the area of wave ii of (c).
More By This Author:
Elliott Wave Technical Analysis: Ethereum, Nov. 3
U.S. Stocks - Elliott Wave Top In Place
Elliott Wave Technical Analysis: KLA Corp. - Wednesday, Nov. 2


Comments
Log in or sign up to join the conversation.