

Corn Elliott Wave Analysis
The corn price action still favors the downside to continue while it’s resisted below 475. In the long term, the current bearish sequence from April 2022 appears to correct the preceding impulse rally between April 2020 and April 2022.
Long Term View
In the long term, Corn prices are in a bearish corrective phase that began in July 2012. This phase is correcting the diagonal 5-wave sequence that started in the 1970s. Corrective structures, apart from triangles, are typically composed of three waves. The first wave of this corrective phase was completed in April 2020, followed by strong rallies that completed the second wave in April 2022. Starting from April 2022, the current decline is expected to represent the third wave, which could extend to $295. Therefore, the corrective phase remains incomplete, and further price declines are anticipated.
Daily Chart Analysis
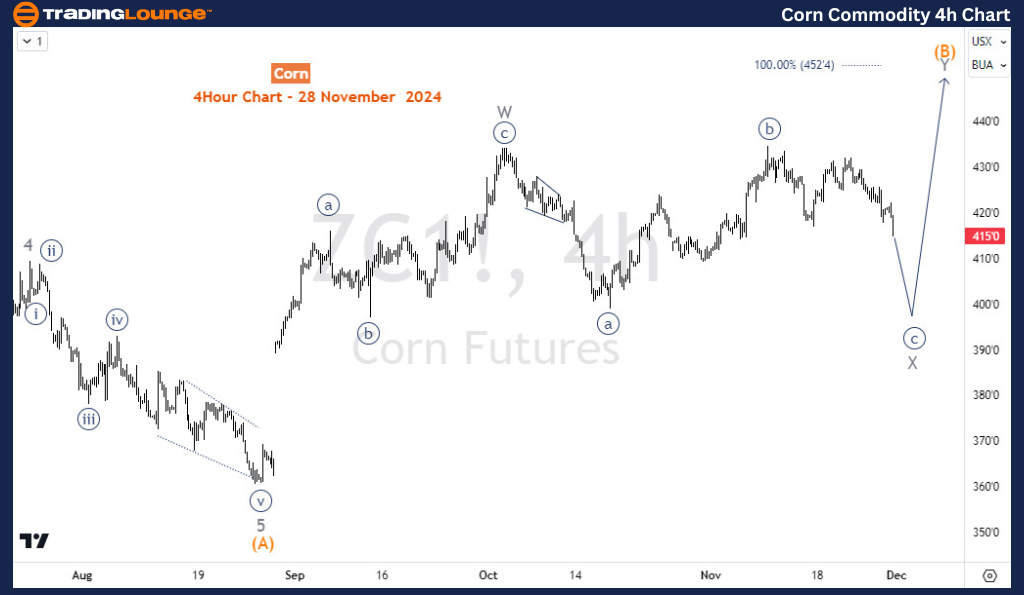
The daily chart focuses on the 3rd leg of this bearish corrective cycle. From $824, the commodity started the 3rd leg which is evolving into a double zigzag structure. After completing waves W and X in the cycle degree, Corn is now in wave Y. However, wave Y is still incomplete, as it is currently still in wave (B) of ((Y)) of Y. As the H4 chart shows, wave (B) could be evolving into a double zigzag structure and currently within the 2nd wave.
.png.33c11dfad8391edea65292cd14d156b7.png)
H4 Chart Analysis
Within wave (B), the price appears to be evolving in a flat structure for wave X. The current dip is wave ((c)) of X and can continue below the 17-October low before wave Y pushes higher, attempting to complete wave (B). Thus, prices can remain choppy in the coming few weeks with no major dominance between the two sides of the market.
Technical Analyst : Sanmi Adeagbo
More By This Author:
Unlocking ASX Trading Success: Sonic Healthcare Limited
Elliott Wave Technical Analysis - The TJX Companies Inc.
Elliott Wave Technical Analysis - CAC 40



Comments
Log in or sign up to join the conversation.