
The TJX Companies Inc., (TJX) Daily Chart
TJX Elliott Wave Technical Analysis
FUNCTION: Trend
MODE: Impulsive
STRUCTURE: Motive
POSITION: Wave {v} of 3 of (5).
DIRECTION: Upside into wave 3.
DETAILS: Looking for upside into wave {v}, equality of 3 vs. 1 stands at 126$ therefore near the end of MinorGroup1. Next upside target would be 1.618 3 vs. 1 at 213$.
.png.7a347ca4a2020b8e21489348ad903f69.png)
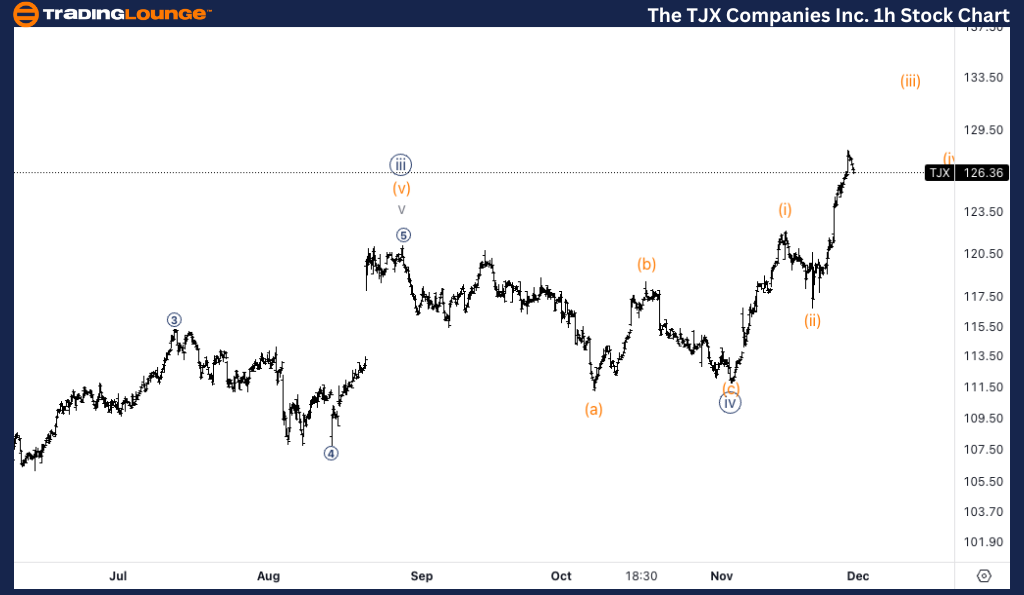
The TJX Companies Inc., (TJX) 1H Chart
TJX Elliott Wave Technical Analysis
FUNCTION: Trend
MODE: Impulsive
STRUCTURE: Motive
POSITION: Wave (iii) of {v}.
DIRECTION: Upside in wave (iii).
DETAILS: Looking for upside into wave (iii) as we seem yet to have completed five waves within wave (iii). Looking for continuation above the end of MG1 at 130$.
This Elliott Wave analysis of The TJX Companies Inc., (TJX) outlines both the daily and 1-hour chart structures, highlighting the current trends and possible future price movements.
* TJX Elliott Wave Technical Analysis – Daily Chart*
TJX is advancing within wave {v} of wave 3 of the larger (5) wave structure. The price is pushing toward the completion of wave 3, with equality of wave 3 vs. wave 1 projected at $126, near the end of MinorGroup1. If the momentum continues, the next target would be 1.618 times wave 1, which would place the upside potential at $213.
* TJX Elliott Wave Technical Analysis – 1H Chart*
On the 1-hour chart, TJX is within wave (iii) of {v}, with upside still unfolding. We have not yet completed the five waves within wave (iii), so further continuation above $130 (the end of MinorGroup1) is expected as the stock completes its impulsive advance.
Technical Analyst : Alessio Barretta
More By This Author:
Elliott Wave Technical Analysis: AAVE Crypto Price News For Thursday, Nov 28
Unlocking ASX Trading Success - Unibail-Rodamco-Westfield
Elliott Wave Technical Analysis - Chevron Inc.


Comments
Log in or sign up to join the conversation.