
CVX Elliott Wave Analysis Trading Lounge
Chevron Inc., (CVX) Daily Chart
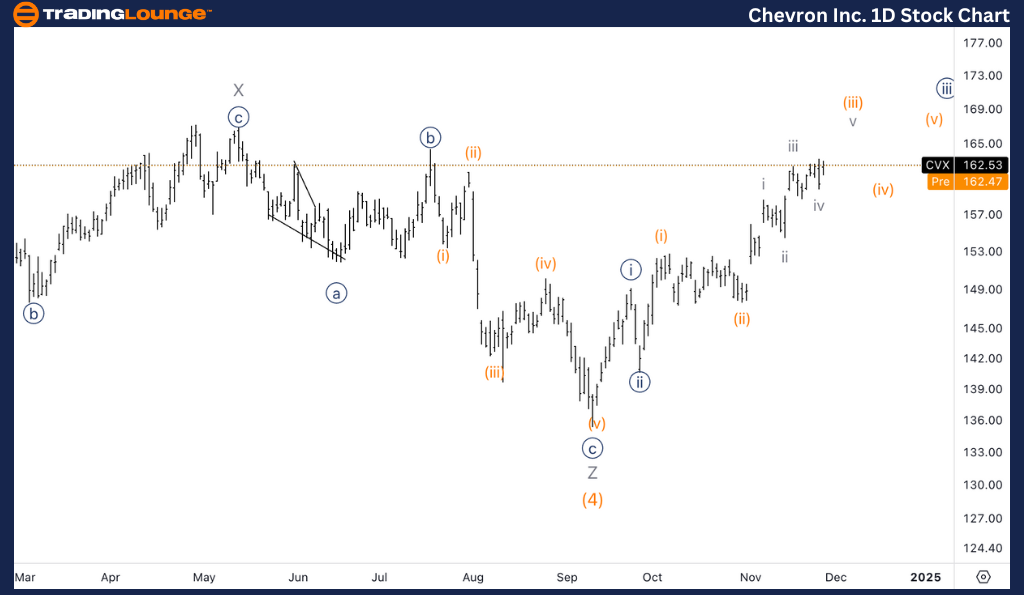
CVX Elliott Wave Technical Analysis
FUNCTION: Trend
MODE: Impulsive
STRUCTURE: Motive
POSITION: Minute {iii}.
DIRECTION: Upside within {iii}.
DETAILS: Looking for upside into wave {iii} as we seem to be missing another wave (iii) and (iv) within {iii}, suggesting we could get towards 200$.
Chevron Inc., (CVX) 1H Chart
CVX Elliott Wave Technical Analysis
FUNCTION: Trend
MODE: Impulsive
STRUCTURE: Motive
POSITION: Wave (iii) of {iii}.
DIRECTION: Upside in wave v of (iii).
DETAILS: Looking for upside into wave (iii) as we seem to be missing another leg higher into wave v. As iii was shorter than i, v must be shorter than iii so we should expect equality at 168$ as maximum target.
.png.7737eb225bdcc815d4d14ebd3a0f5391.png)
This analysis focuses on the current trend structure of Chevron Inc., (CVX) utilizing the Elliott Wave Theory on both the daily and 1-hour charts. Below is a breakdown of the stock's position and potential future movements.
* CVX Elliott Wave Technical Analysis – Daily Chart*
Chevron (CVX) is progressing within minute wave {iii} of the larger impulsive structure, with additional upside expected. There appears to be missing subdivisions for waves (iii) and (iv) within {iii}, suggesting a further extension in this move. The target for this wave structure lies near $200, marking the expected completion of wave {iii}.
* CVX Elliott Wave Technical Analysis – 1H Chart*
On the 1-hour chart, Chevron is advancing within wave v of (iii). With wave iii shorter than wave i, wave v is expected to be constrained to be shorter than wave iii, limiting its maximum target to $168 based on equality with previous wave structures. This suggests a measured but steady move higher in the near term as wave {iii} approaches completion.
Technical Analyst : Alessio Barretta
More By This Author:
Unlocking ASX Trading Success - Unibail-Rodamco-Westfield
Elliott Wave Technical Analysis - TASI Index
Elliott Wave Technical Analysis - U.S. Dollar/Japanese Yen - Wednesday, Nov. 27


Comments
Log in or sign up to join the conversation.