


Image Source: Pixabay
Block Inc., Elliott Wave Technical Analysis
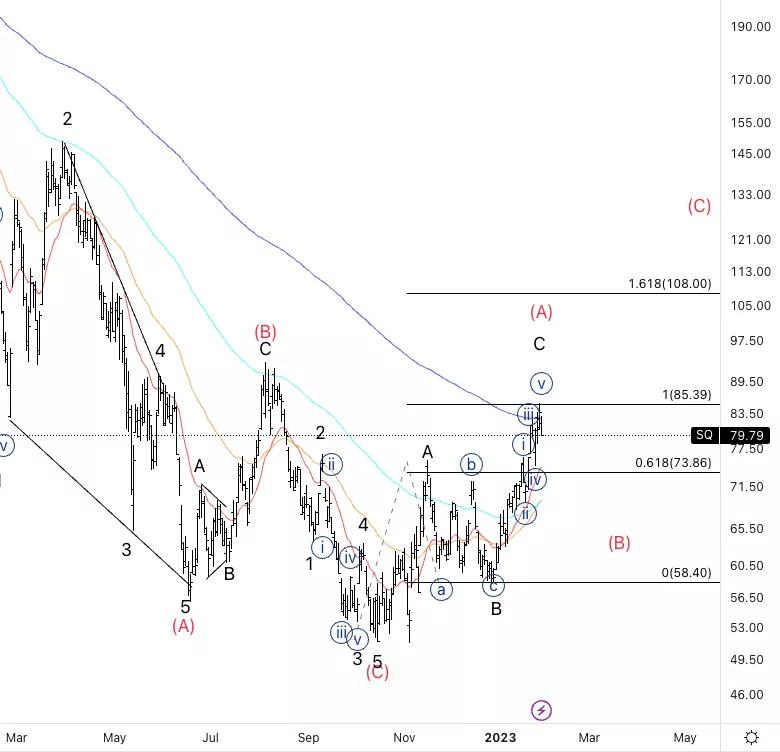
Block Inc., (Nasdaq: SQ): Daily Chart, 31 January 2023.
SQ Stock Market Analysis: At this point, I am considering the possibility of an ending diagonal in wave C to then retrace lower into wave (B). We have touched and found resistance to the equality of C vs. A.
SQ Elliott Wave Count: Wave {v} of C.
SQ Technical Indicators: 200EMA as resistance.
SQ Trading Strategy: Looking for downside in wave (B) to then start looking for shorts.
Analyst: Alessio Barretta
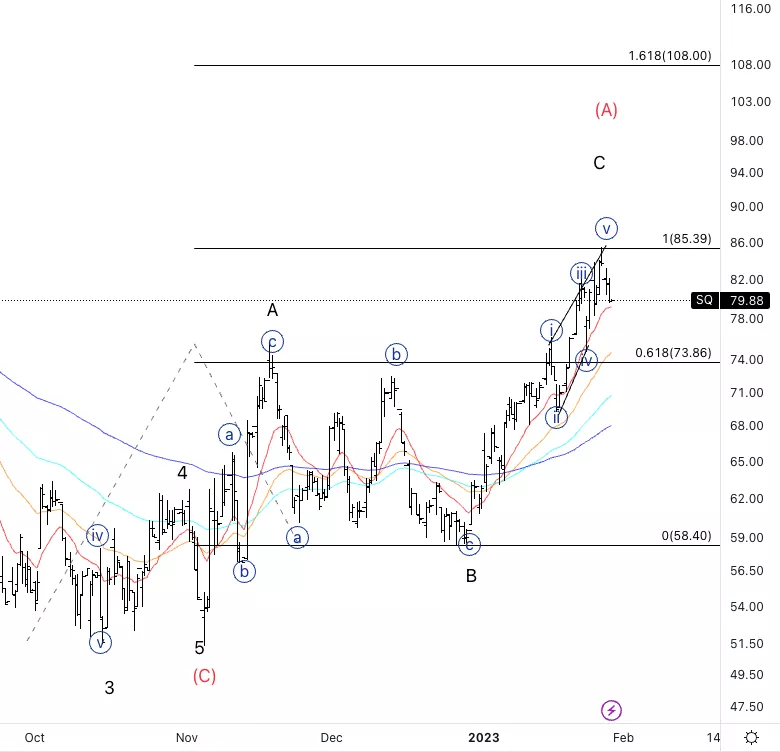
Block Inc., SQ: 4-hour Chart, 31 January 2023.
Block Inc., Elliott Wave Technical Analysis
SQ Stock Market Analysis: Looking for a sharp move down soon to confirm the count, ideally we can break the bottom of wave {iv} to have further confirmation.
SQ Elliott Wave count: Wave (i) of {a}.
SQ Technical Indicators: Above all averages.
SQ Trading Strategy: Looking for confirmation to then build shorts.
More By This Author:
Elliott Wave Technical Analysis: Bitcoin / U.S. Dollar, Jan. 31
S&P 500 Index Analysis And Forecast
Elliott Wave Technical Analysis: Texas Instruments Inc. - Monday, Jan. 30



Comments
Log in or sign up to join the conversation.