

Image Source: Unsplash
Texas Instruments Inc., Elliott Wave Technical Analysis
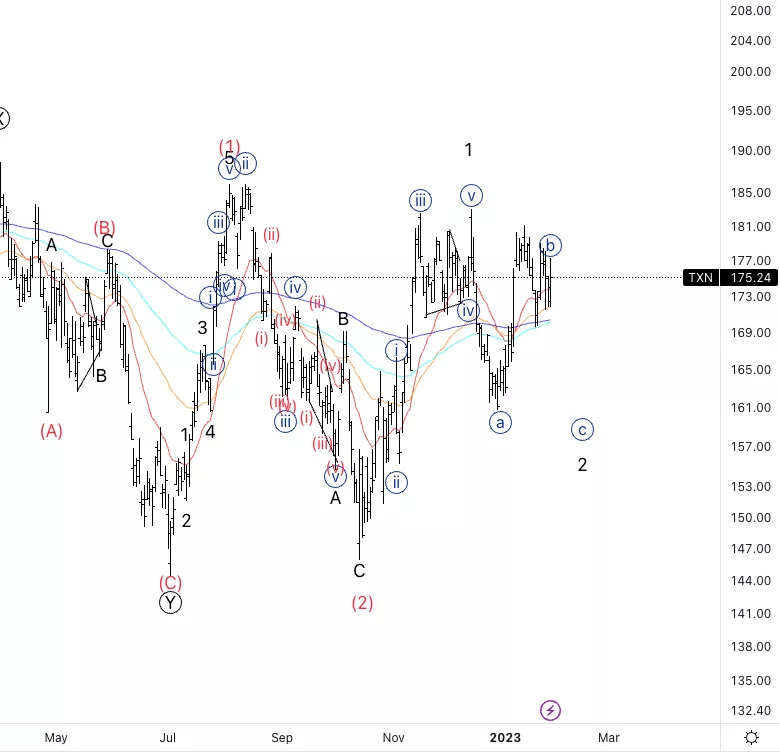
Texas Instruments Inc.,(Nasdaq: TXN): Daily Chart, 30 January 2023.
TXN Stock Market Analysis: Looking for completion of wave 2 after a potential five-wave sequence in wave 1 of (3).
TXN Elliott WaveCount: Wave{b} of2.
TXN Technical Indicators: 20EMA as support.
TXN Trading Strategy: Looking for downside in wave {c} to then start looking for longs.
Analyst: Alessio Barretta
Texas Instruments Inc., TXN: 4-hour Chart, 30 January 2023
Texas Instruments Inc., Elliott Wave Technical Analysis
TXN Stock Market Analysis: The move up in wave 1 can also be counted as a three-wave move which makes me doubt the count as a whole. However, the potential triangle seems clear for now.
TXN Elliott Wave count: Wave(e) of{b}.
TXN Technical Indicators: 20EMA as resistance.
TXN Trading Strategy: You could place shorts on the triangle looking to trade wave {c}.

More By This Author:
Theta/USD Elliott Wave Technical Analysis For Jan. 30
Maximize Your Stock Market Returns: Latest News On SP500, Top Tech Stocks
Elliott Wave Technical Analysis: Honeywell Inc. - Friday, Jan. 27


Comments
Log in or sign up to join the conversation.