

Image Source: Unsplash
Biogen Inc., Elliott Wave Technical Analysis
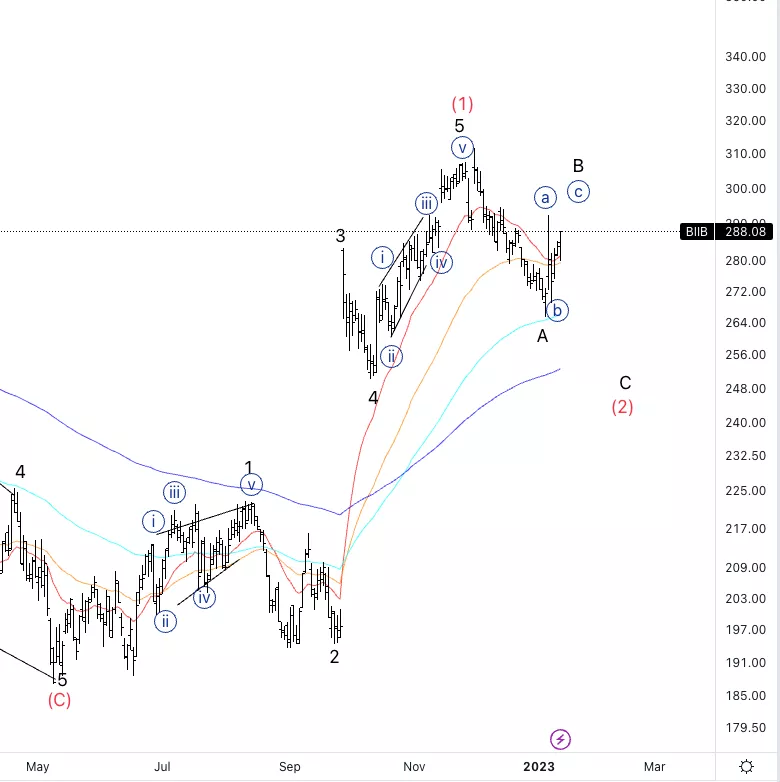
Biogen Inc., (Nasdaq: BIIB): Daily Chart, 13 January 23,
BIIB Stock Market Analysis: We are looking for further downside into wave C which could take us back to the area of wave 4.
BIIB Elliott Wave Count: Wave {c} of B.
BIIB Technical Indicators: Above all averages
BIIB Trading Strategy: Looking for shorts into wave C.
Analyst: Alessio Barretta
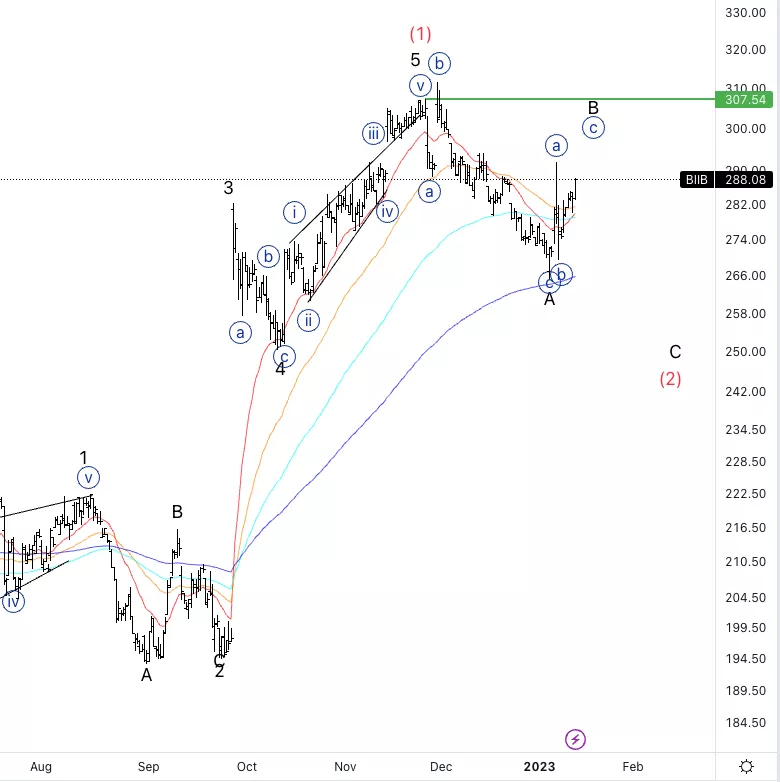
Biogen Inc., BIIB:4-hour Chart, 13 January 23,
Biogen Inc., Elliott Wave Technical Analysis
BIIB Stock Market Analysis: We are missing one more leg higher into wave {c} of B which could be used for short-term trades. After that, we’ll start looking for shorts.
BIIB Elliott Wave count: Wave {c} of B.
BIIB Technical Indicators: Above all averages
BIIB Trading Strategy: Looking for shorts into wave C, we could get resistance at equality of {c}vs. {a}
More By This Author:
Elliott Wave Technical Analysis: Analog Devices Inc. - Thursday, Jan. 12
U.S. Stock Market Technical Analysis - Thursday, Jan. 12
Elliott Wave Technical Analysis: Honeywell International Inc. - Wednesday, Jan. 11


Comments
Log in or sign up to join the conversation.