

Photo by Joshua Mayo on Unsplash
Analog Devices Inc., Elliott Wave Technical Analysis
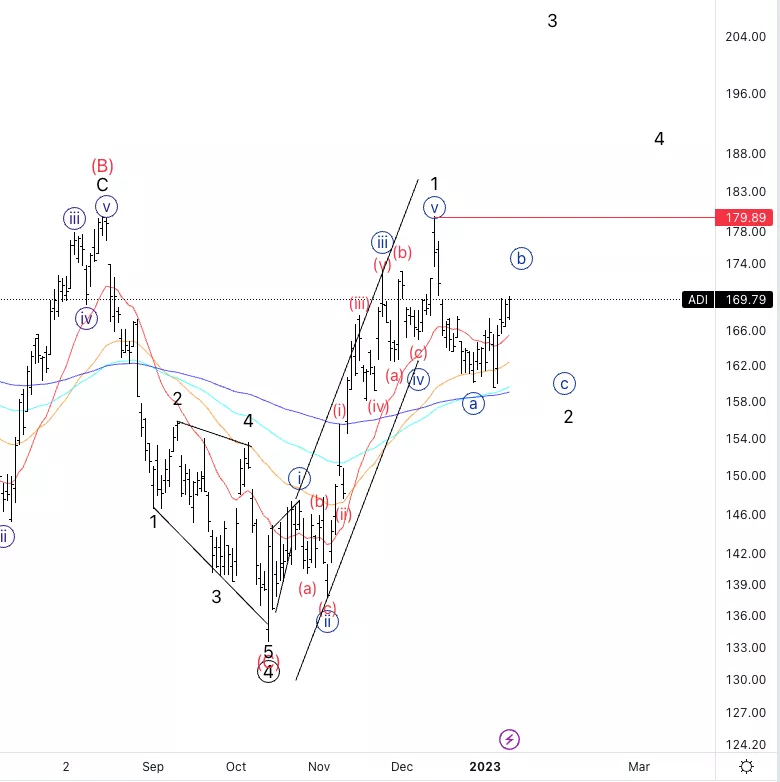
Analog Devices Inc., (Nasdaq: ADI): Daily Chart, 12 January 23,
ADI Stock Market Analysis: We are witnessing a larger retracement which seems to correspond to wave 2. We could still be in wave {b} of 2 or else we have completed wave 2 already.
ADI Elliott Wave Count: Wave {b} of 2.
ADI Technical Indicators: Above all averages
ADI Trading Strategy: Looking for shorts into wave {c}.
Analyst: Alessio Barretta
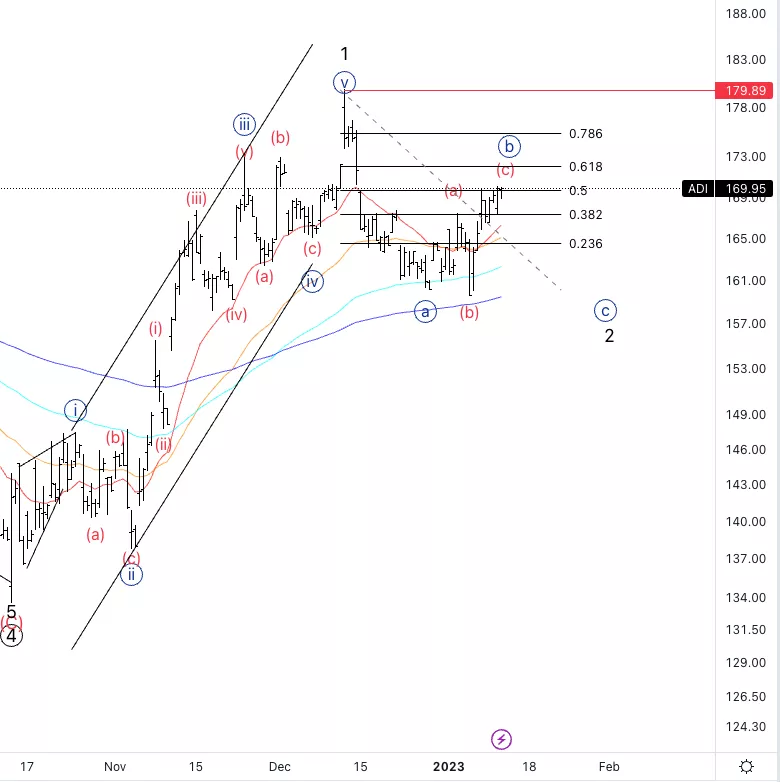
Analog Devices Inc., ADI:4-hour Chart, 12 January 23,
Analog Devices Inc., Elliott Wave Technical Analysis
ADI Stock Market Analysis: Looking for resistance around the 61.8% retracement. The invalidation level would be a break of the red line which would confirm the idea that wave 2 is completed.
ADI Elliott Wave count: Wave (c) of {c}.
ADI Technical Indicators: Above all averages
ADI Trading Strategy: Looking for shorts on wave {b}, confirmation is needed first.
More By This Author:
U.S. Stock Market Technical Analysis - Thursday, Jan. 12
Elliott Wave Technical Analysis: Honeywell International Inc. - Wednesday, Jan. 11
Elliott Wave Technical Analysis: Bitcoin / U.S. Dollar - Jan. 11


Comments
Log in or sign up to join the conversation.