

Analog Devices Inc., Elliott Wave Technical Analysis

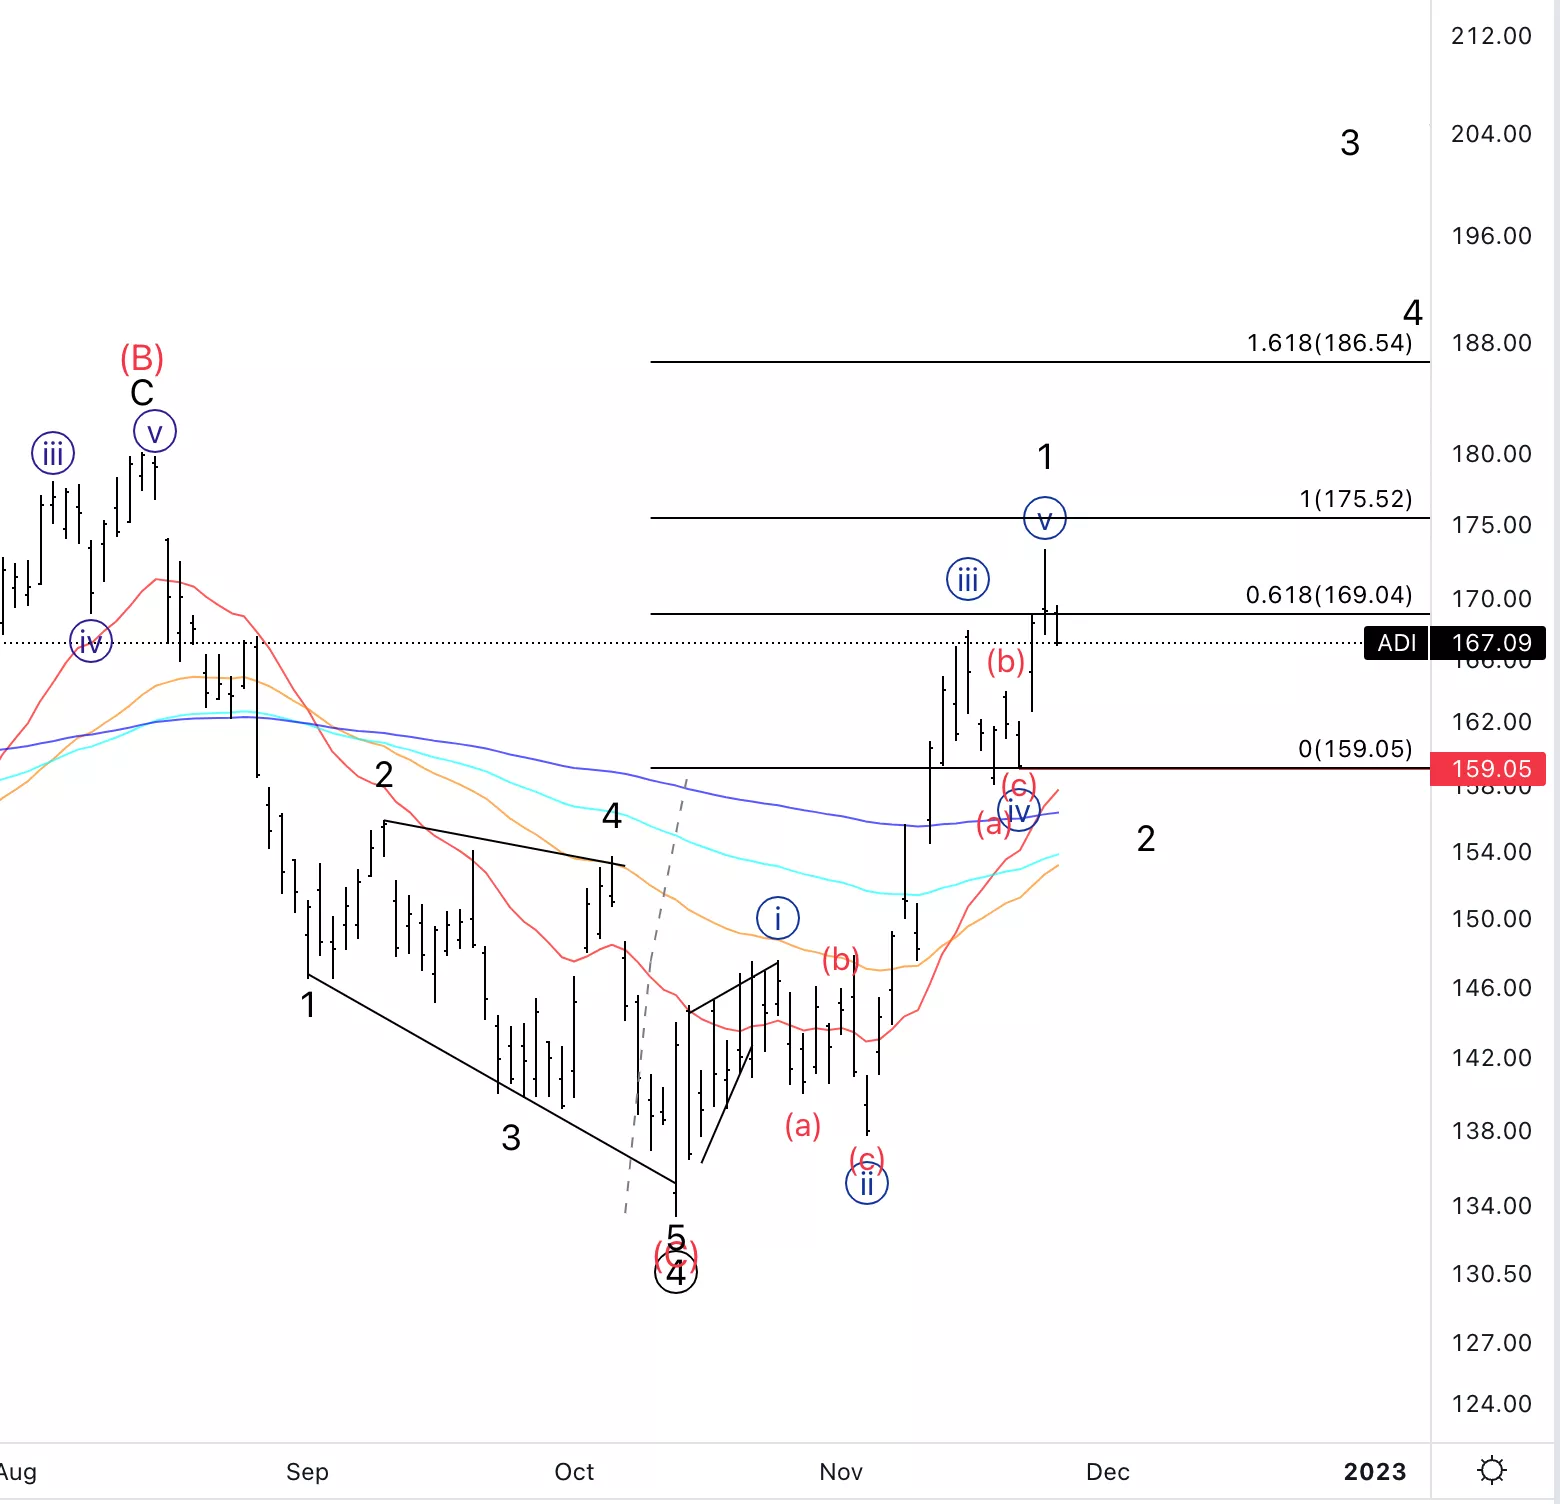
Analog Devices Inc., (ADI): Daily Chart, November 28 2022,
ADI Stock Market Analysis: We are anticipating a potential top in place while we were still looking for short term trades into wave {v}. At this point it looks like we might have topped and are ready to resume lower.
ADI Elliott Wave Count: Wave {a} of 2.
ADI Technical Indicators: Above all averages.
ADI Trading Strategy: Looking for further developments into wave 2 to then place long term longs.
TradingLounge Analyst: Alessio Barretta
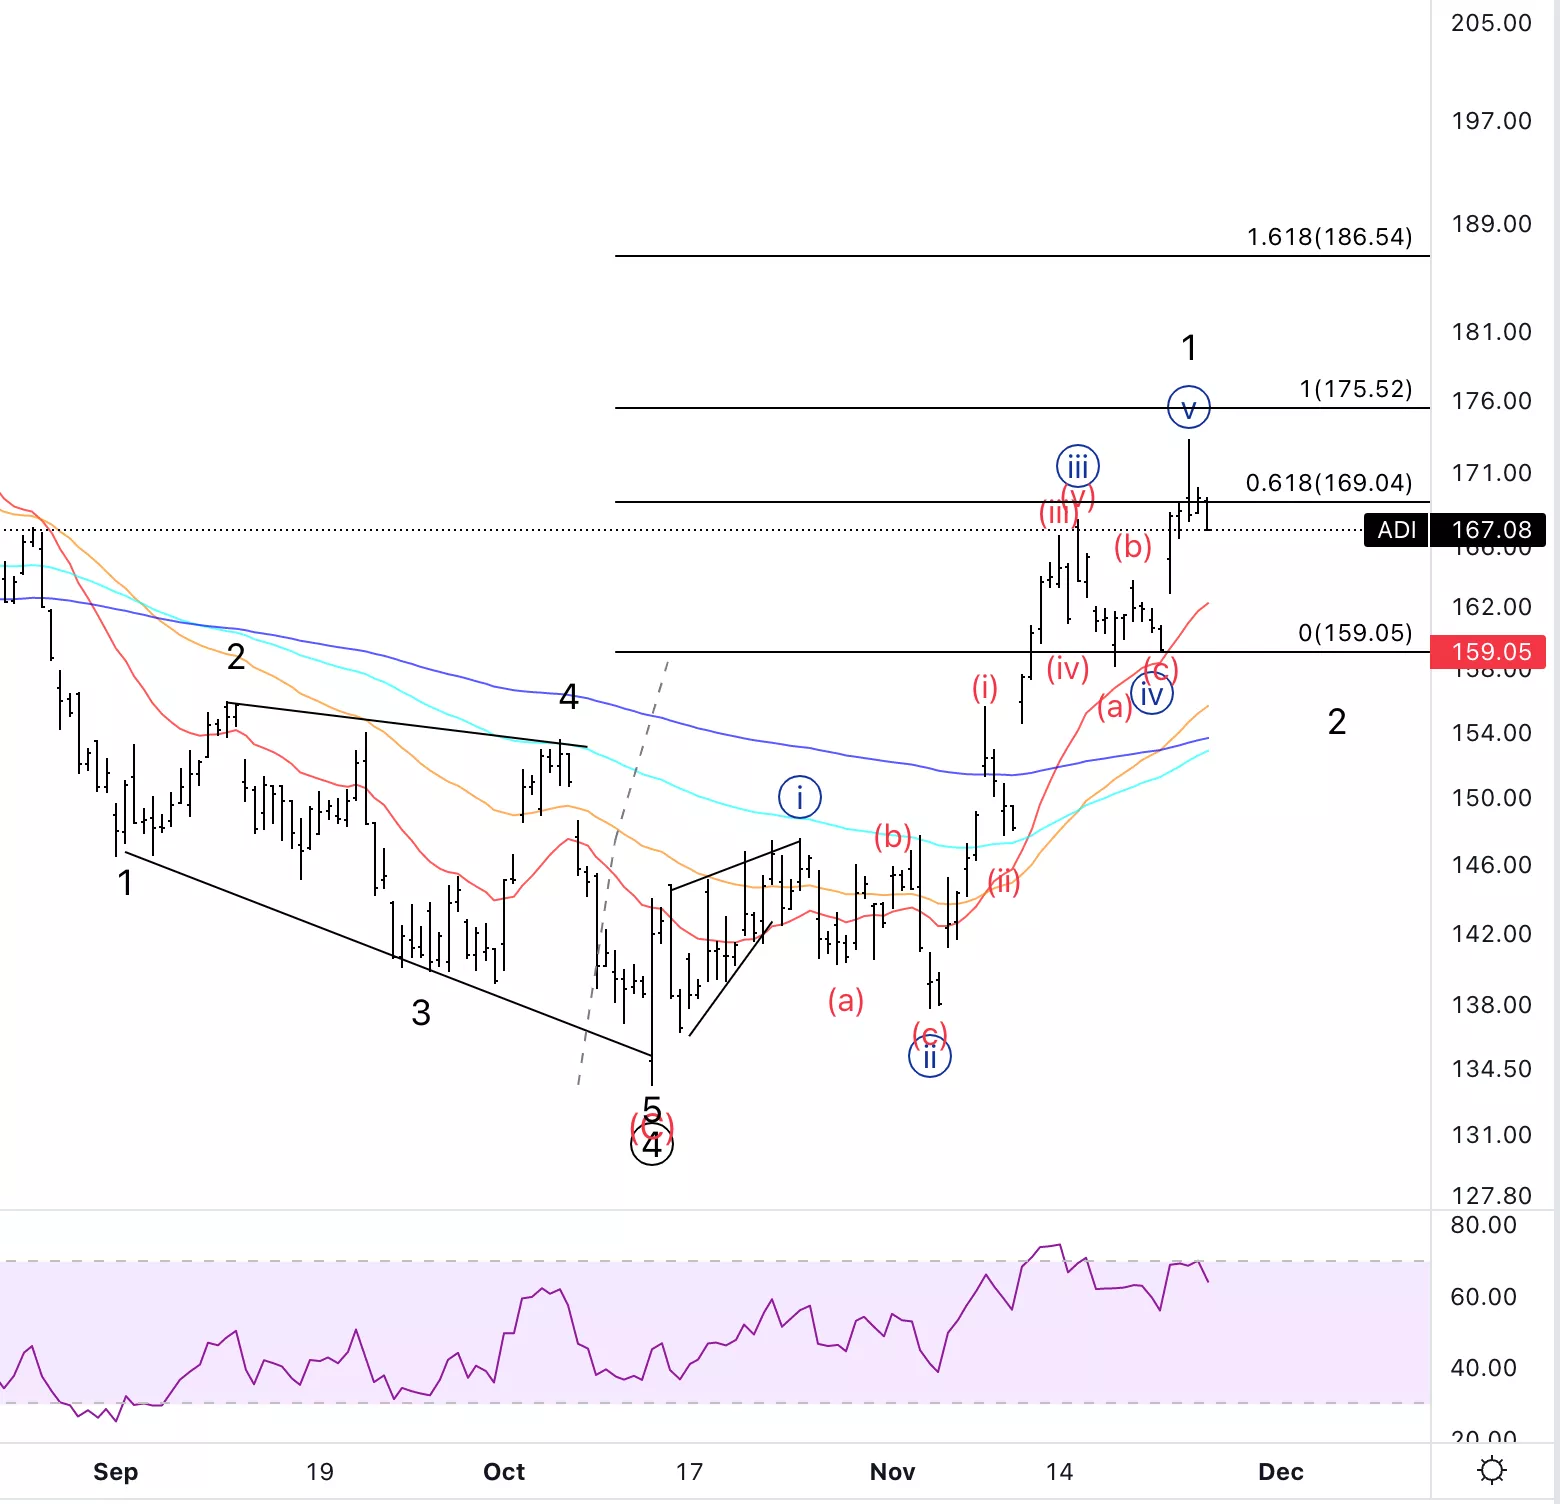
Analog Devices Inc., ADI: 4-hour Chart, November 28 2022
Analog Devices Inc., Elliott Wave Technical Analysis
ADI Stock Market Analysis: As the RSI also suggests we may have topped in wave {v} as we’ve had divergence between the top of {v} and {iii}. Looking for further downside.
ADI Elliott Wave count: Wave i of {a}.
ADI Technical Indicators: Above all averages, while 100 and 200EMAs are crossing.
ADI Trading Strategy: If volatility rises we could look for short term shorts.
More By This Author:
Dogecoin (DOGEUSD) Elliott Wave Technical Analysis
Elliott Wave Stock Market Summary - SP500, US Stocks
Elliott Wave Technical Analysis: Shopify Inc. - Friday, Nov. 25



Comments
Log in or sign up to join the conversation.