

Shopify Inc., Elliott Wave Technical Analysis
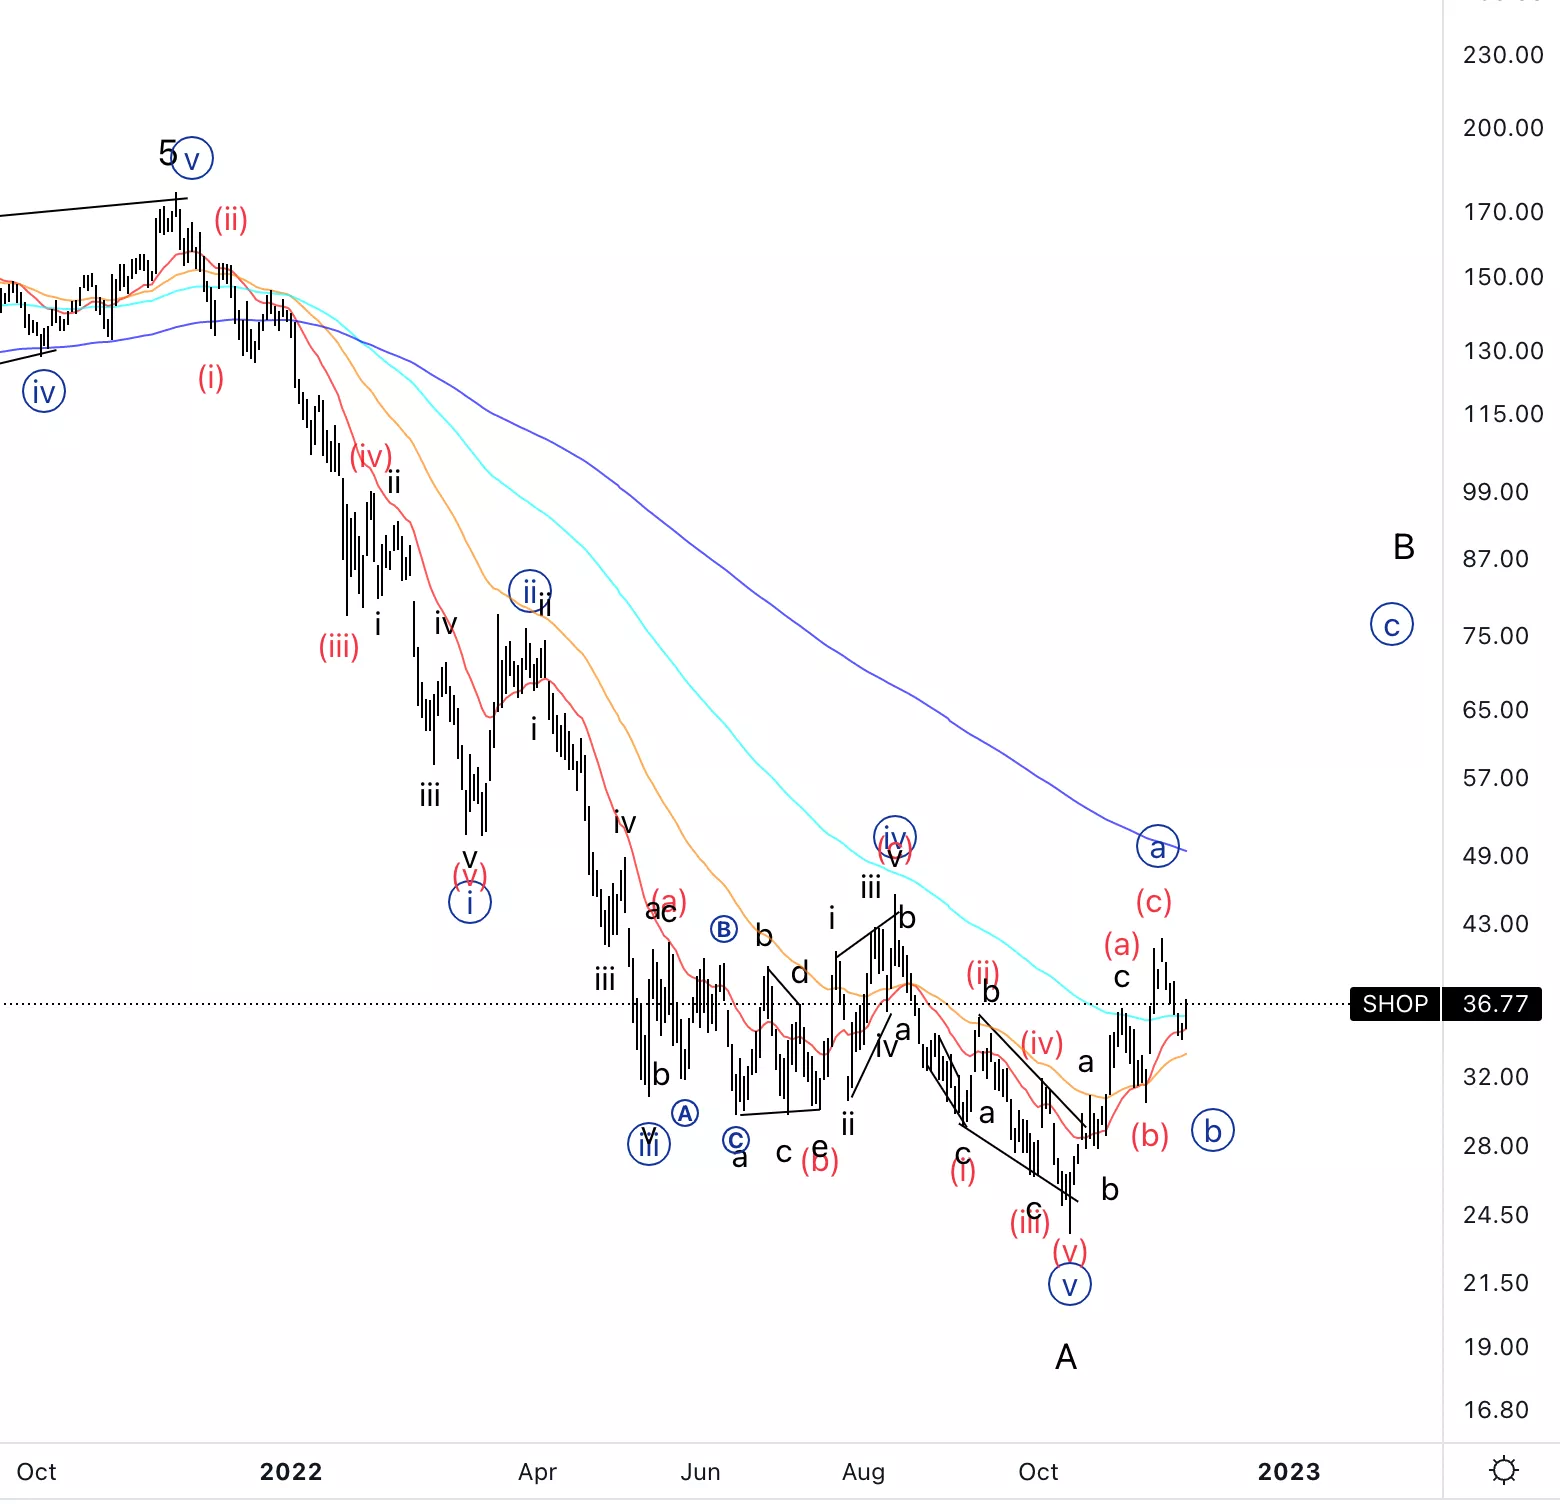
Shopify Inc., (Nasdaq: SHOP): Daily Chart, November 25, 2022,
SHOP Stock Market Analysis: We are expecting a sideways or else downward move into wave{b} of B to then have the last upside move and complete wave C.
SHOP Elliott Wave Count: Wave (a) of {b}.
SHOP Technical Indicators:20EMA acting as support.
SHOP Trading Strategy: Looking for further developments into wave {b}. A break south of 23 could be seen as wave count invalidation.
Analyst: Alessio Barretta
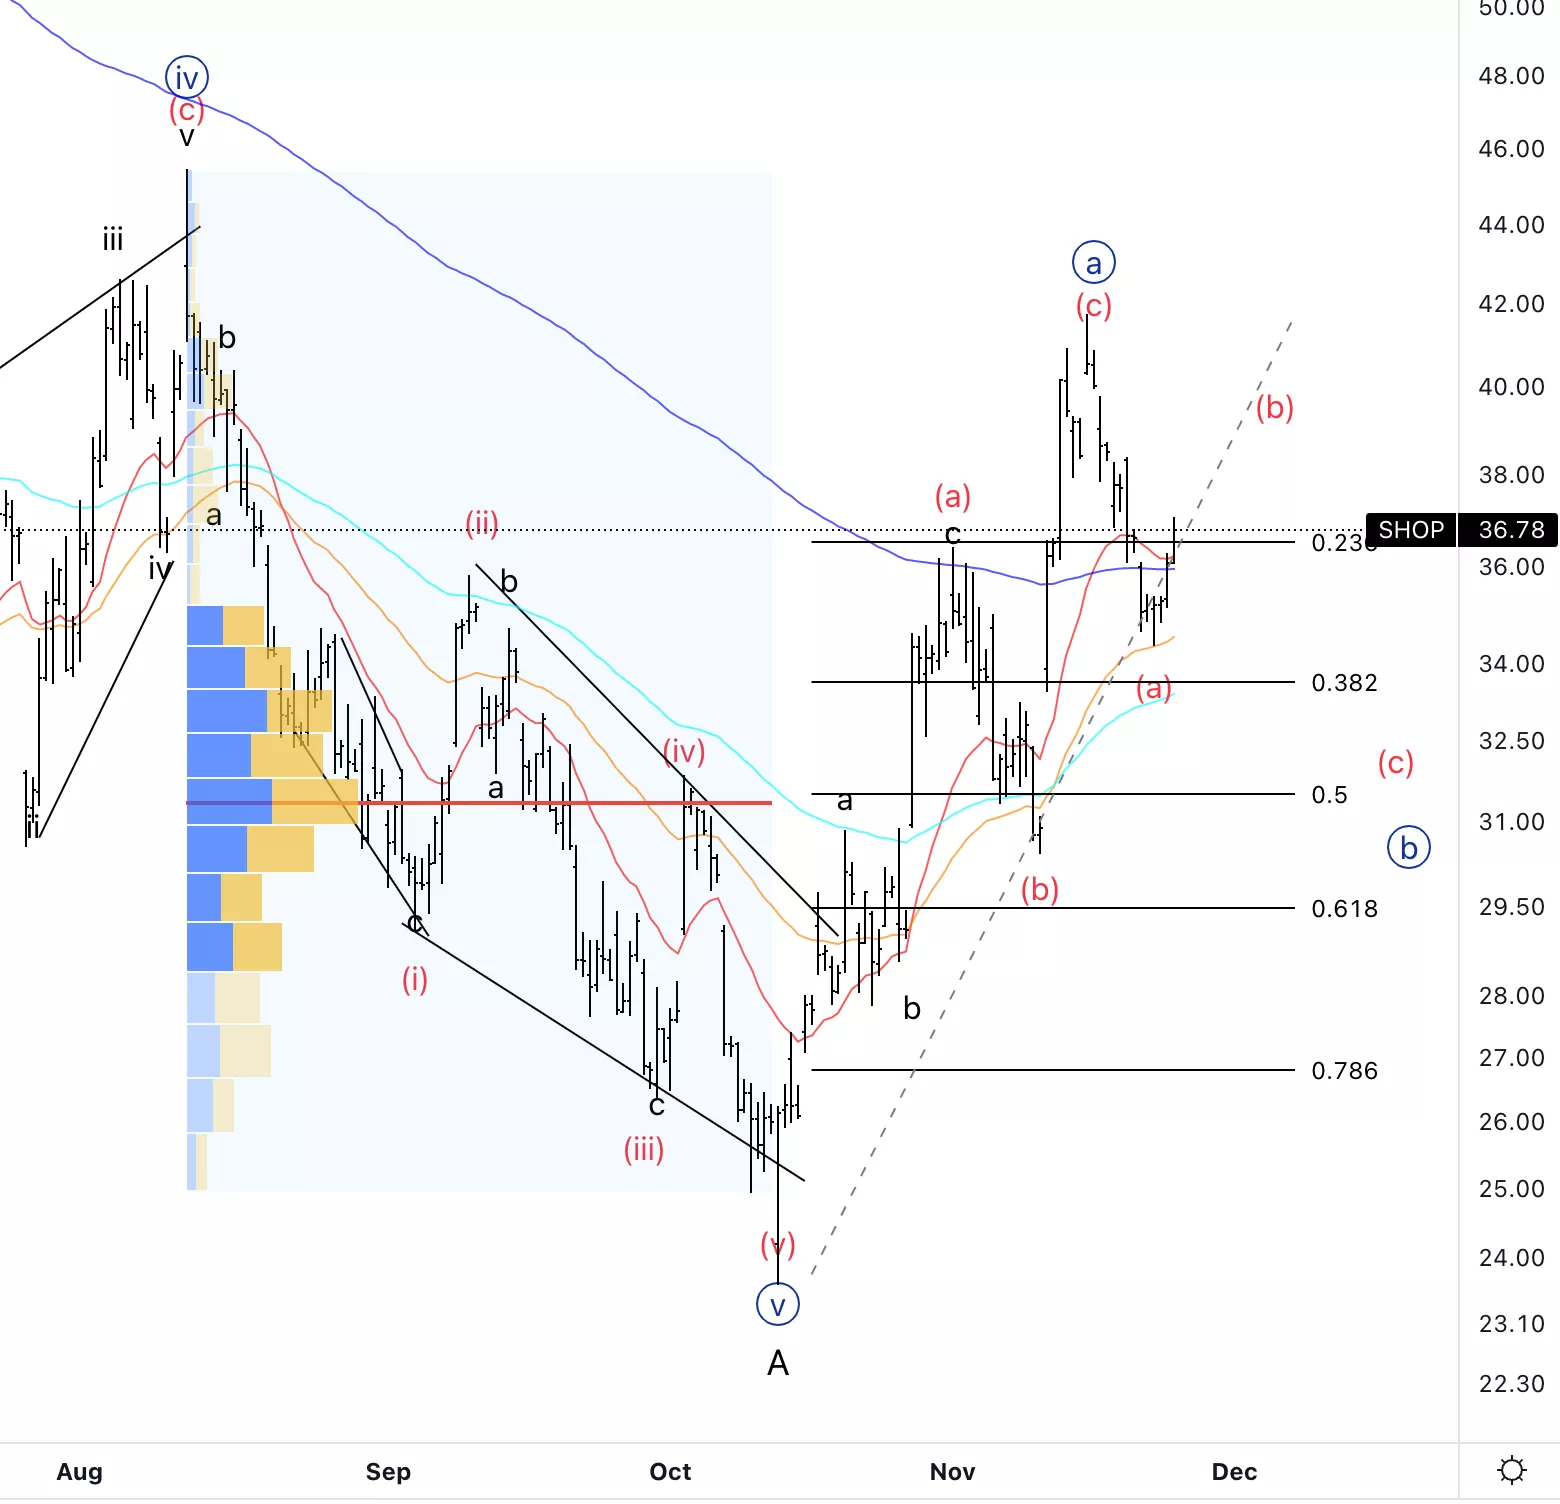
Shopify Inc., SHOP: 4-hour Chart, November 25, 2022
Shopify Inc., Elliott Wave Technical Analysis
SHOP Stock Market Analysis: Looking for further into the pullback in wave b of (b) to then look for further downside into wave (c).
SHOP Elliott Wave count: Wave a of (b).
SHOP Technical Indicators: Above all averages, crossing of the 200 and 20EMA. Strong volume at just above 31$.
SHOP Trading Strategy: Looking for the pullback in wave (b) to retrace deeper to then eventually look for short-term shorts.
More By This Author:
ASX200 Elliott Wave Analysis
Elliott Wave Technical Analysis: Theta Token, Thursday, Nov. 24
SP500, Nasdaq, Russell 2000, And Dow Jones: Elliott Wave Technical Analysis


Comments
Log in or sign up to join the conversation.