


Image Source: Unsplash
Analog Devices Inc., Elliott Wave Technical Analysis
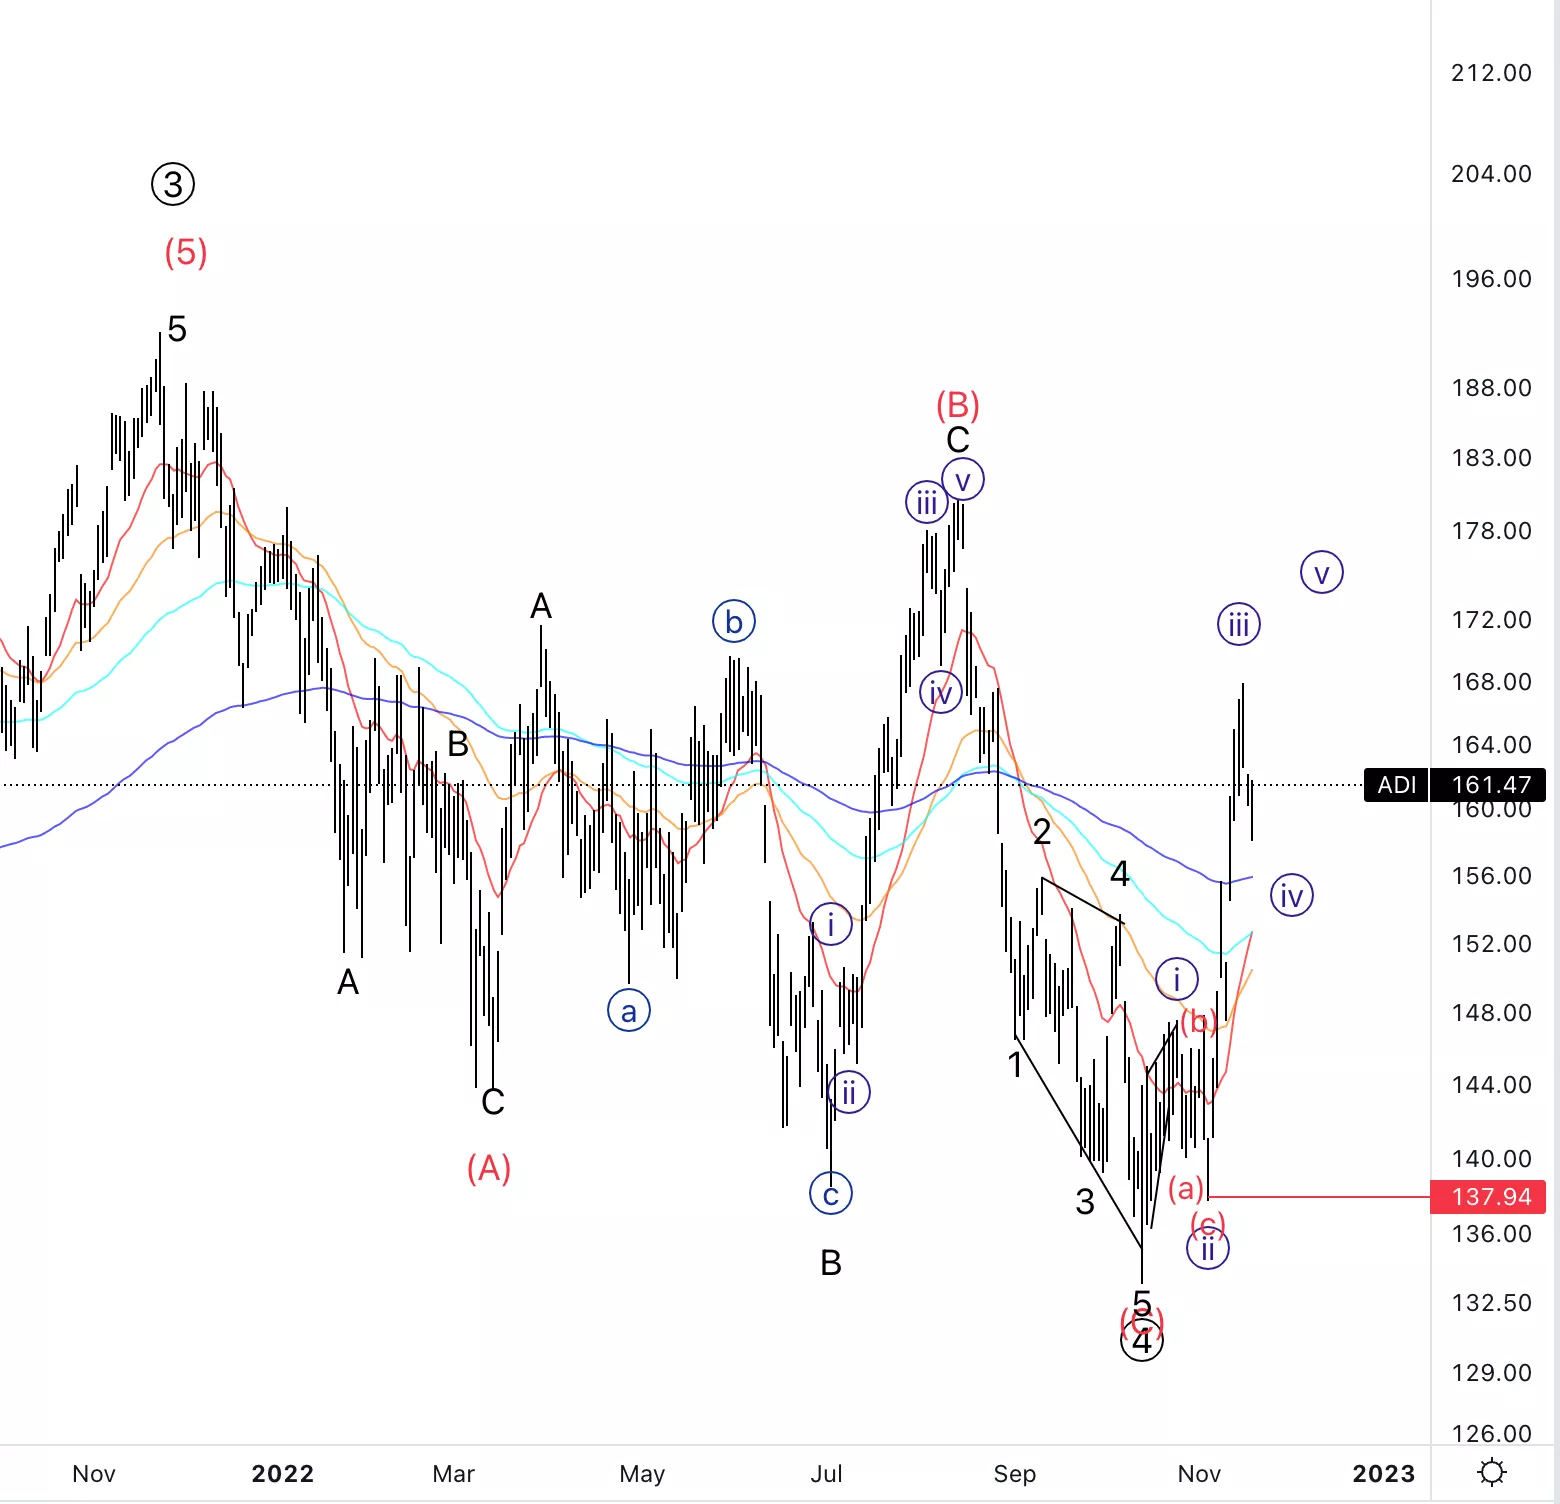
Analog Devices Inc., (Nasdaq: ADI): Daily Chart, November 18, 2022,
ADI Stock Market Analysis: Moving perfectly s expected from the previous forecast. Looking for a pullback in wave {iv} which should represent a buyable opportunity.
ADI Elliott Wave Count: Wave {iv} of 1.
ADI Technical Indicators: Above all averages
ADI Trading Strategy: Looking for confirmation of wave {iv}.
Analyst: Alessio Barretta
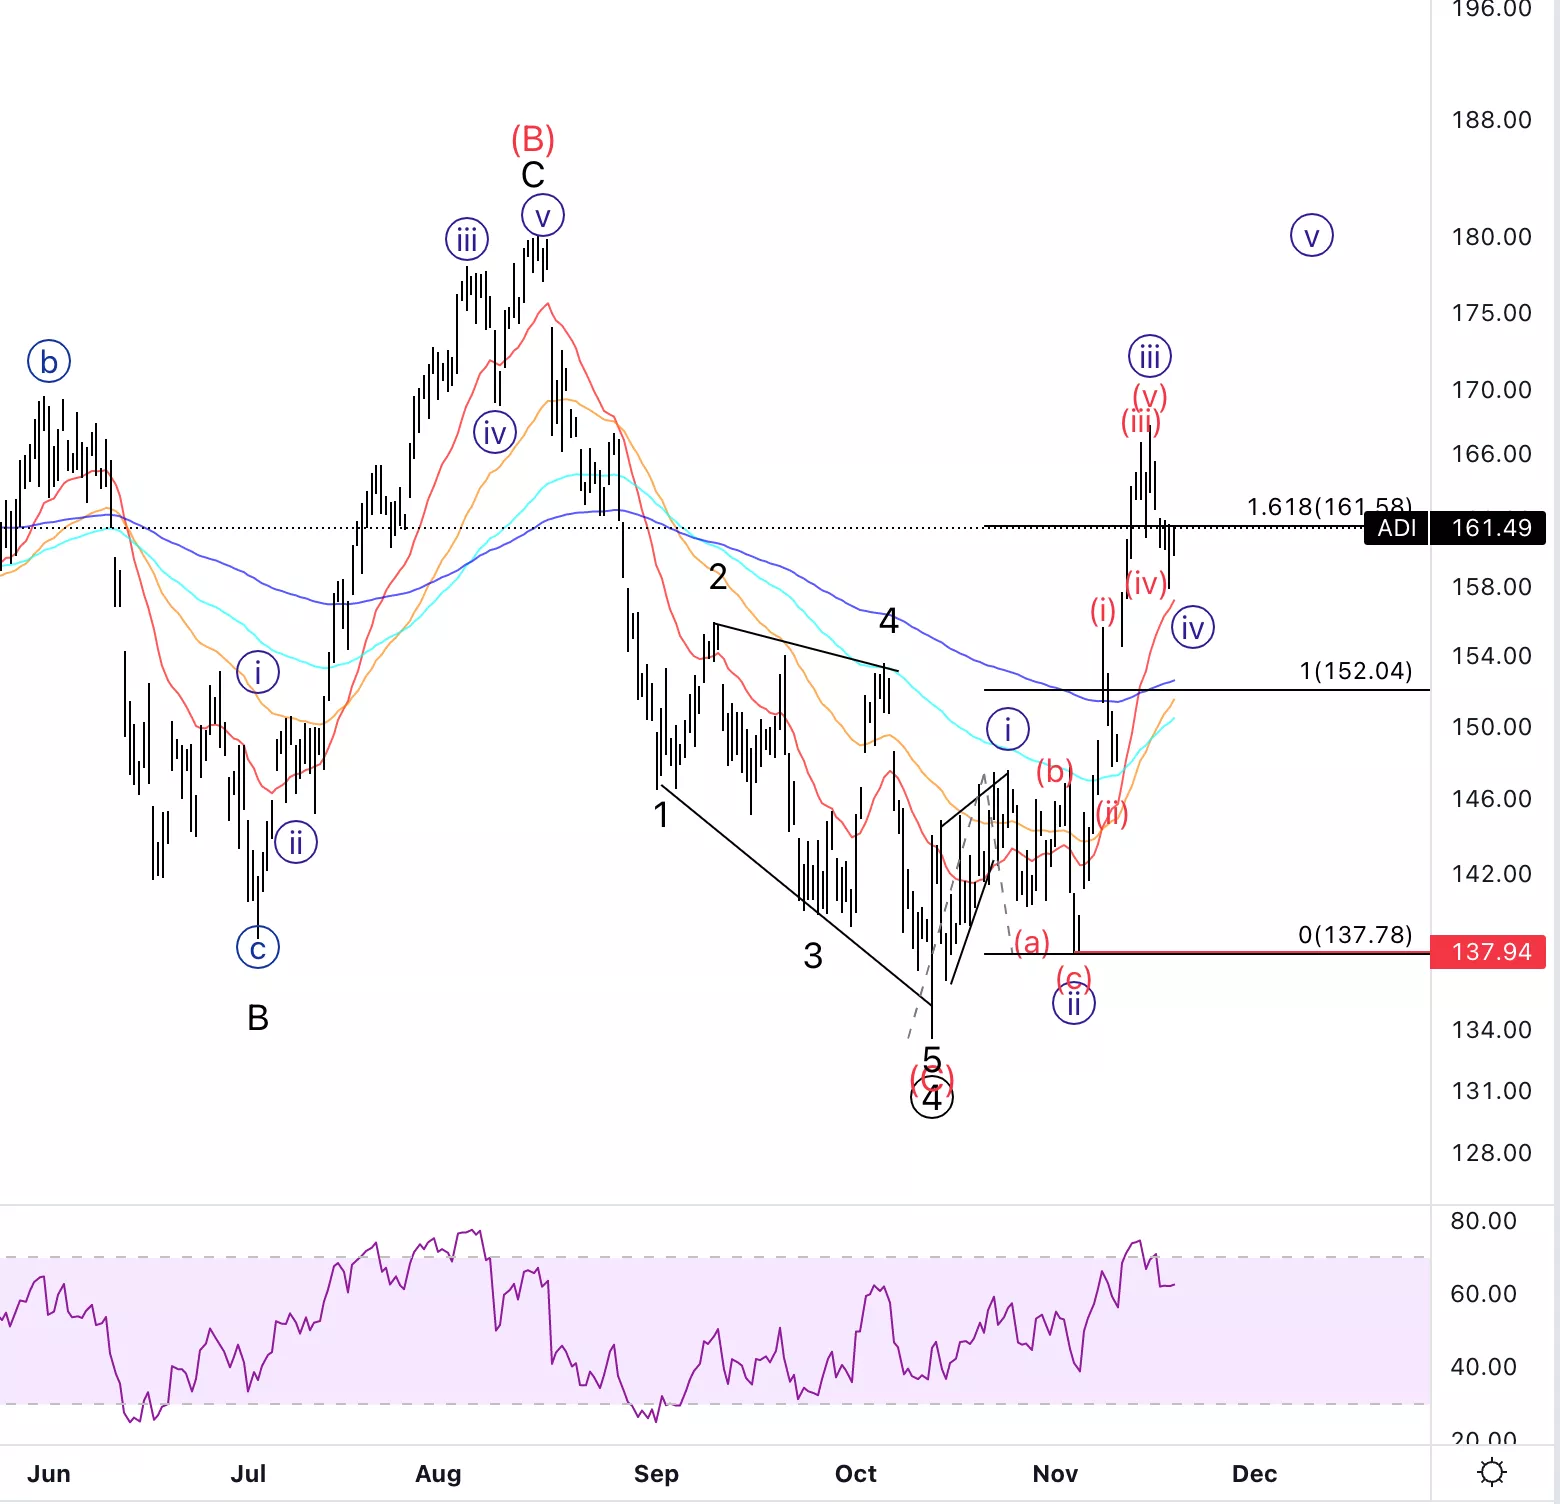
Analog Devices Inc., ADI: 4-hour Chart, November 18, 2022
Analog Devices Inc., Elliott Wave Technical Analysis
ADI Stock Market Analysis: We are finding support off the 1.618 {iii} vs. {i} as the 20EMA is getting closer.
ADI Elliott Wave count: Wave (a) of {iv}.
ADI Technical Indicators: Above all averages, RSI bearish divergence which could indicate an imminent wave {v}.
ADI Trading Strategy: Looking for longs into wave {v}.
More By This Author:
Elliott Wave Analysis: Commodity Markets
Elliott Wave Technical Analysis: Bitcoin (BTCUSD)
Elliott Wave Technical Analysis: Broadcom Inc. - Thursday, Nov. 17



Comments
Log in or sign up to join the conversation.