
Photo by Maxim Hopman on Unsplash
Broadcom Inc., Elliott Wave Technical Analysis
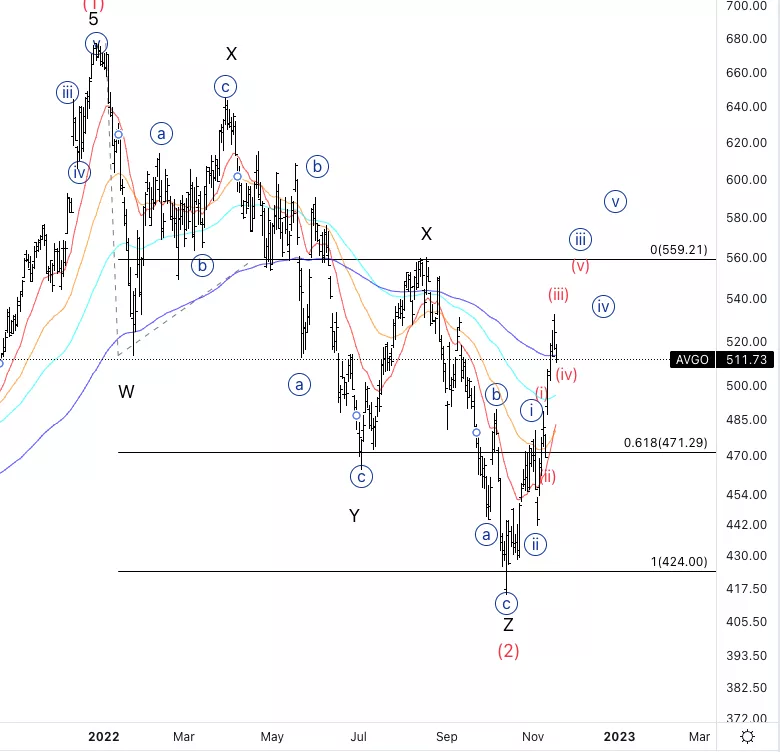
Broadcom Inc., (Nasdaq: AVGO): Daily Chart, November 17, 2022,
AVGO Stock Market Analysis: We have been tracking down the possibility of a wave (2) of the intermediate degree to have bottomed at around 410$ and the following up move could be the beginning of the new uptrend.
AVGO Elliott Wave Count: Wave {iii} of 1.
AVGO Technical Indicators: Finding support on the 200EMA
AVGO Trading Strategy: Waiting for a pullback in wave (iv) and {iv} to place short-term longs.
Analyst: Alessio Barretta
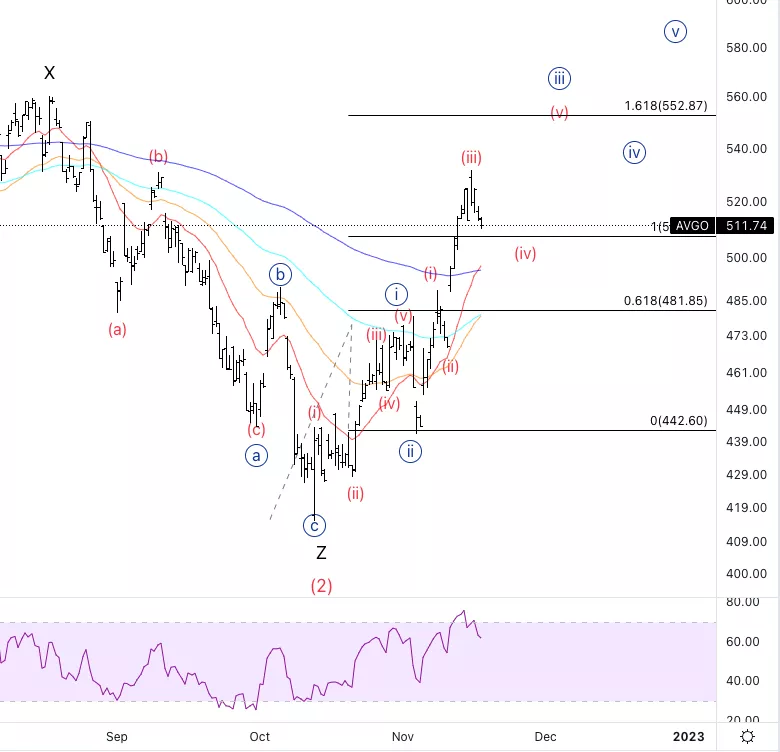
Broadcom Inc., AVGO: 4-hour Chart, November 17, 2022
Broadcom Inc., Elliott Wave Technical Analysis
AVGO Stock Market Analysis: It looks like we might have entered wave (iv) which I would expect to be sideways. I will be looking for longs into wave (v).
AVGO Elliott Wave count: Wave (iv) of {iii}.
AVGO Technical Indicators: Above all averages, RSI bearish divergence could indicate an imminent wave (v).
AVGO Trading Strategy: Looking for longs on the wave (iv) once we get a clearer view of how it is going to look (potentially sideways).
More By This Author:
FAANG Stocks Technical Analysis - Elliott Wave
Elliott Wave Technical Analysis: Honeywell International Inc. - Wednesday, Nov. 16
Elliott Wave Technical Analysis: Dogecoin - Wednesday, Nov. 16


Comments
Log in or sign up to join the conversation.