
AMZN Elliott Wave Analysis
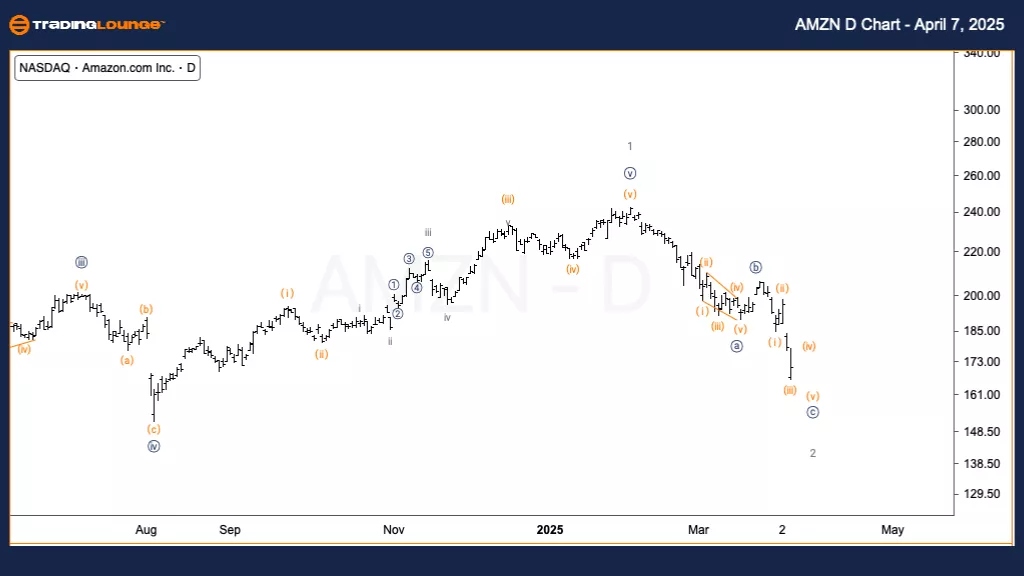
Amazon.com Inc. (AMZN) – Daily Chart
- Function: Counter Trend
- Mode: Corrective
- Structure: Zigzag
- Position: Wave 2
- Analysis: The daily chart shows Amazon in a corrective Minor wave 2. It is forming a zigzag pattern with downside likely continuing into wave {c}. A more extended correction remains possible if current price action is only wave {a}.
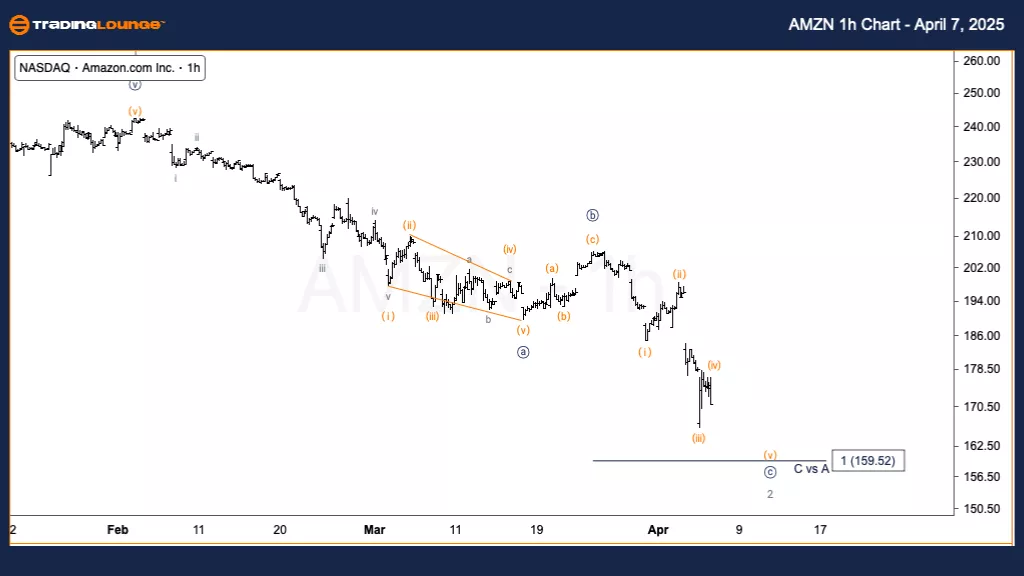
Amazon.com Inc. (AMZN) – 1-Hour Chart
- Function: Counter Trend
- Mode: Corrective
- Structure: Zigzag
- Position: Wave (iv) of {c}
- Analysis: The hourly chart points to the final stages of wave {c}, with wave (v) likely targeting the $159 level, which aligns with wave equality between {c} and {a}. This zone could serve as a pivot point for the next reversal.
Technical Analyst: Alessio Barretta
More By This Author:
Elliott Wave Technical Forecast: Insurance Australia Group Limited - Monday, April 7
Elliott Wave Technical Analysis: U.S. Dollar/Japanese Yen - Monday, April 7
Elliott Wave Technical Analysis: Bitcoin Crypto Price - Monday, April 7


Comments
Log in or sign up to join the conversation.