
Adobe Inc., Elliott Wave Technical Analysis

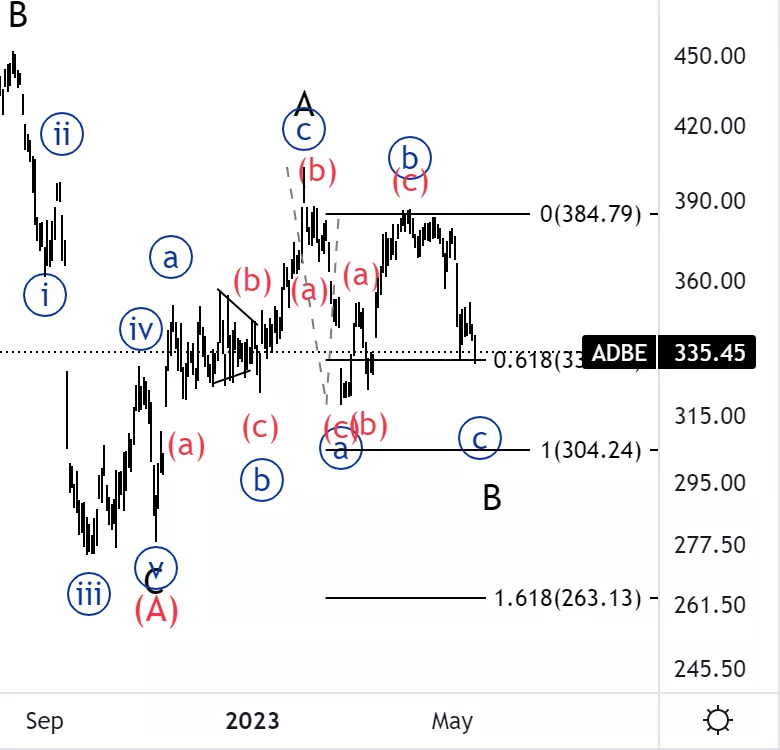
Adobe Inc., (ADBE): Daily Chart, 15 May 23,
ADBE Stock Market Analysis: Looking for further downside into wave {c} as we are looking at a larger correction in Minor wave B to be near completion.
ADBE Elliott Wave Count: Wave {c} of B.
ADBE Technical Indicators: Below all averages.
ADBE Trading Strategy: Looking for longs after reaching equality of {c} vs. {a} to then try to take advantage of the upswing in wave C.
TradingLounge Analyst: Alessio Barretta
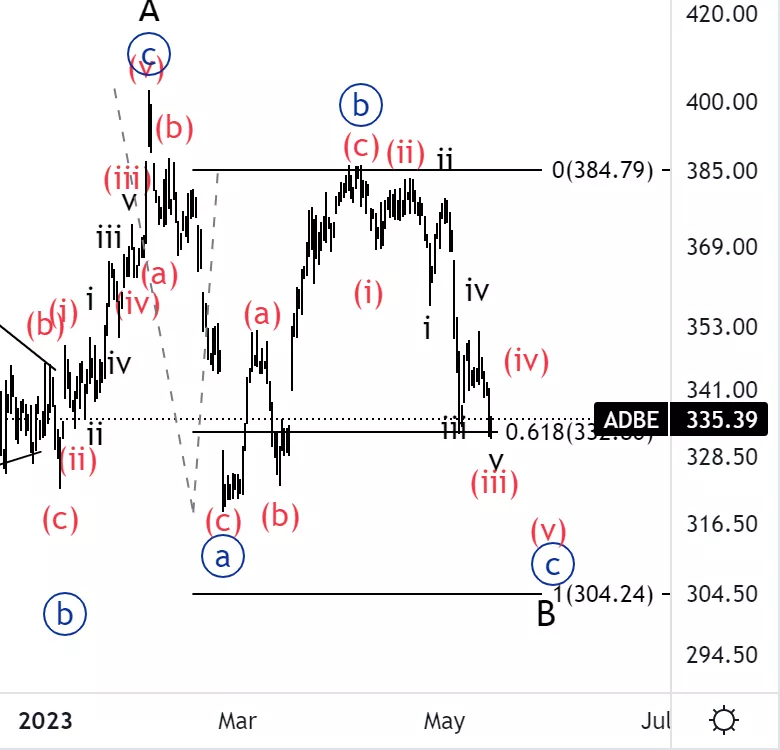
Adobe Inc., ADBE: 4-hour Chart, 15 May 23,
Adobe Inc., Elliott Wave Technical Analysis
ADBE Stock Market Analysis: It looks like we are in wave (iii) of {c} as we have extended lower. Looking for a pullback into wave (iv) to then look for additional shorts. Ideally wave (iv) finds resistance near the wave four of one lesser degree, therefore wave iv.
ADBE Elliott Wave count: Wave (iv) of {c}.
ADBE Technical Indicators: Below all averages.
ADBE Trading Strategy: Looking for downside into wave (v) after we get a clear view of wave (iv).
More By This Author:
Elliot Wave Technical Analysis: BNBUSD - Monday, May 15
Elliot Wave Technical Analysis: S&P 500 - Sunday, May 14
Elliott Wave Technical Analysis: Okta Inc. - Friday, May 12


Comments
Log in or sign up to join the conversation.