

Image Source: Pixabay
Okta Inc., Elliott Wave Technical Analysis
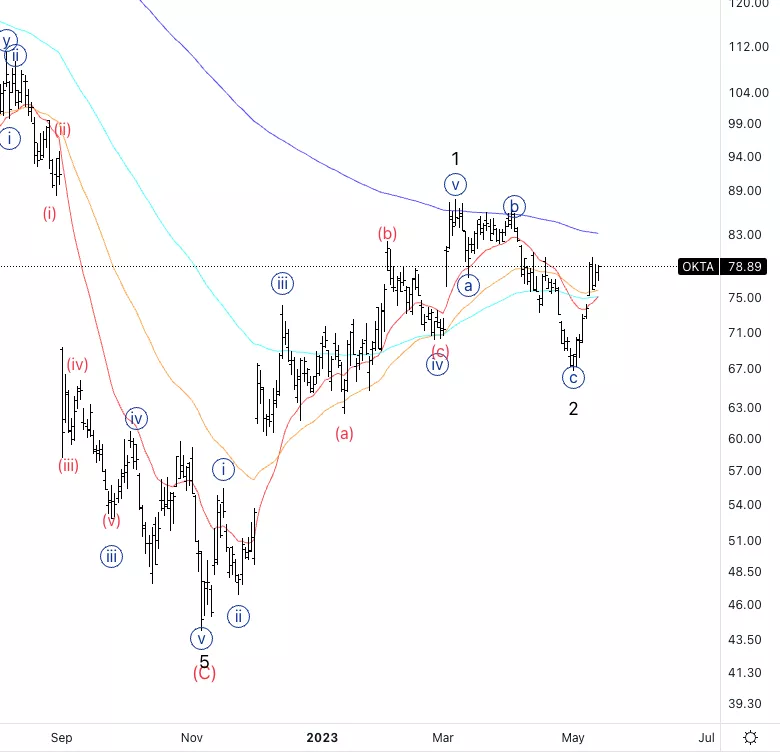
Okta Inc., (Nasdaq: OKTA): Daily Chart, 12 May 2023.
OKTA Stock Market Analysis: Looking for upside resumption into wave 3 as we seem to have completed a three wave move into wave 2.
OKTA Elliott Wave Count: Wave {i} of 3.
OKTA Technical Indicators: Above 20EMA.
OKTA Trading Strategy: Looking for longs into wave {iii} after we get a successful three wave move pullback.
Analyst: Alessio Barretta
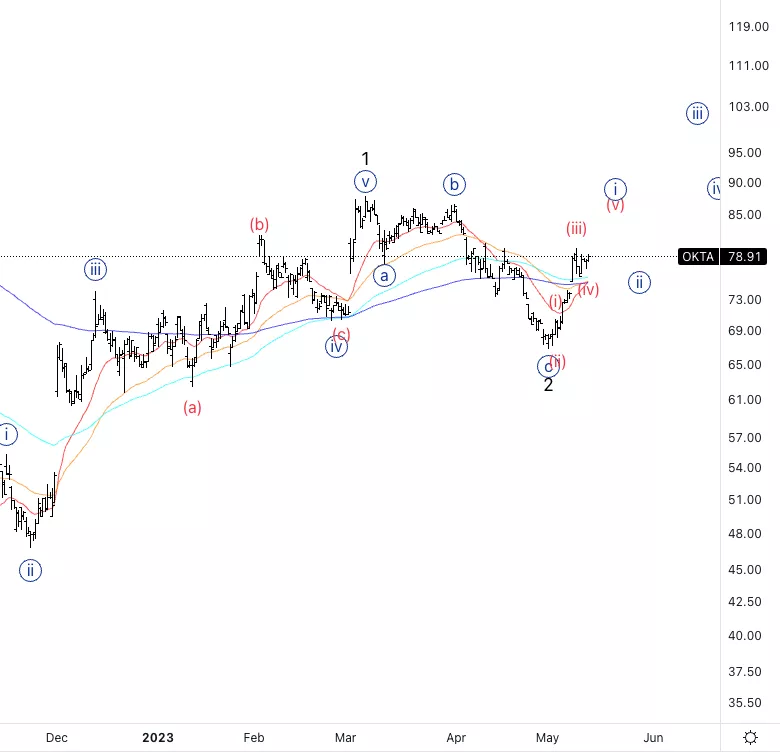
Okta Inc., OKTA: 1-hour Chart, 12 May 2023.
Okta Inc., Elliott Wave Technical Analysis
OKTA Stock Market Analysis: We can identify a three wave move into wave {i}. It looks like we are in some sort of a triangle or sideways movement into wave (iv) and we should be resuming higher.
OKTA Elliott Wave count: Wave (iv) of {i}.
OKTA Technical Indicators: Above all averages.
OKTA Trading Strategy: Looking for further upside into wave (v) which could be traded intraday, to then expect a three wave move pullback into wave {ii}.
More By This Author:
Elliott Wave Technical Analysis: NEO/U.S. Dollar - Friday, May 12
Elliott Wave Technical Analysis: Cintas Corp. - Thursday, May 11
Elliott Wave Technical Analysis: Ethereum, May 11


Comments
Log in or sign up to join the conversation.