Elliott Wave Technical Analysis: Cintas Corp. - Thursday, May 11
Image Source: Unsplash
Cintas Corp., Elliott Wave Technical Analysis
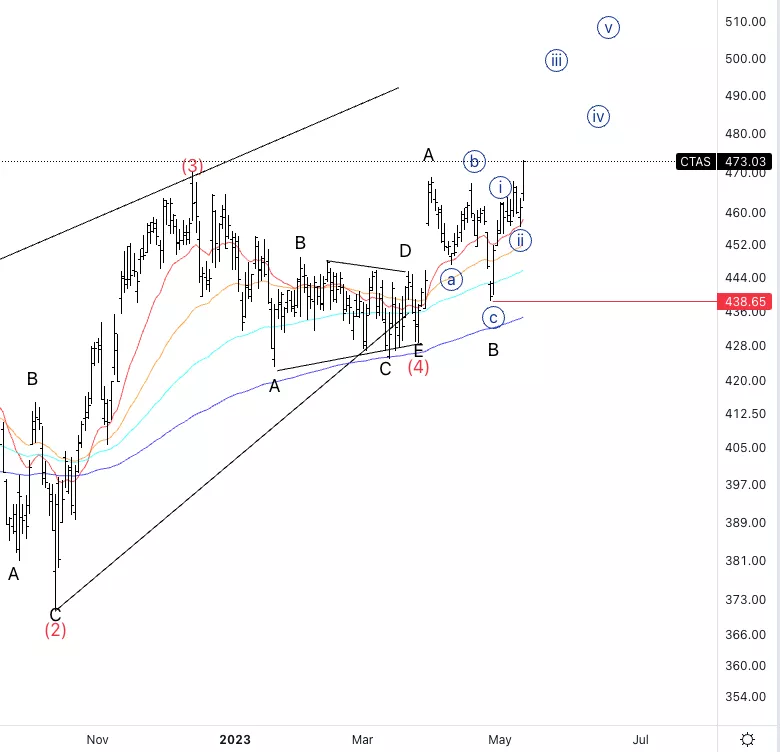
Cintas Corp., (Nasdaq: CTAS): Daily Chart, 11 May 2023.
CTAS Stock Market Analysis: Moving higher as we forecasted in the previous post. Looking for further upside into wave C as we are expecting an ending diagonal into primary wave 5.
CTAS Elliott Wave Count: Wave {iii} of C.
CTAS Technical Indicators: Above all averages.
CTAS Trading Strategy: Looking for longs into wave {iii} with a stop below wave {ii}.
Analyst: Alessio Barretta

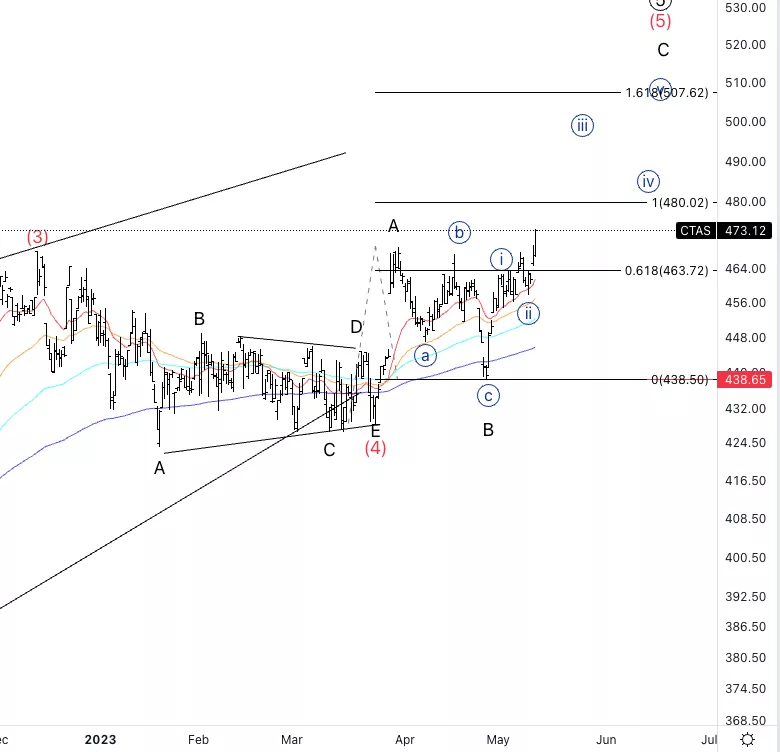
Cintas Corp., CTAS: 1-hour Chart, 11 May 2023.
Cintas Corp., Elliott Wave Technical Analysis
CTAS Stock Market Analysis: Looking for more upside room left as we could reach anywhere between equality and 1.618 of C vs. A, potentially around 500$.
CTAS Elliott Wave count: Wave {iii} of C.
CTAS Technical Indicators: Above all averages.
CTAS Trading Strategy: Looking for longs into wave {iii} with a stop below wave {ii}.

More By This Author:
Elliott Wave Technical Analysis: Ethereum, May 11
Elliott Wave Technical Analysis: Twist Bioscience Corp. - Wednesday, May 10
Elliott Wave Technical Analysis: Theta Token/U.S. Dollar - Wednesday, May 10
Analyst Peter Mathers TradingLounge™ Australian Financial Services Licence - AFSL 317817


