

Image Source: Unsplash
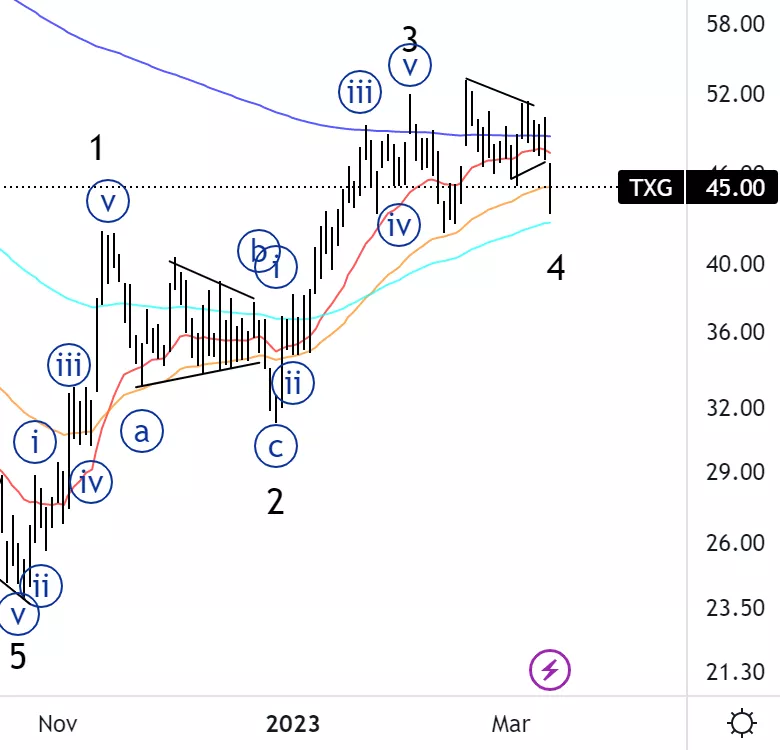
10x Genomics Inc., Elliott Wave Technical Analysis
10x Genomics Inc., (Nasdaq: TXG): Daily Chart, 13 March 2023.
TXG Stock Market Analysis: At this point, we are looking at a potential wave 4 with a triangle in wave {b}. We are very close to invalidation level.
TXG Elliott Wave Count: Wave {c} of 4.
TXG Technical Indicators: Below both 20 and 200EMA.
TXG Trading Strategy: Looking for longs into wave 5.
Analyst: Alessio Barretta
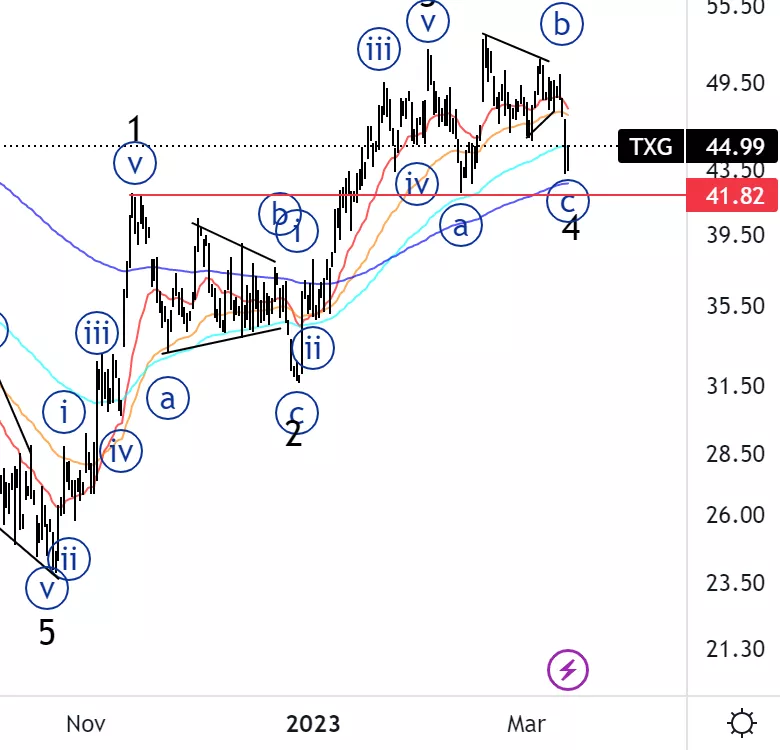
10x Genomics Inc., TXG: 4-hour Chart, 13 March 2023.
10x Genomics Inc., Elliott Wave Technical Analysis
TXG Stock Market Analysis: Looking for upside resumption soon or else the count will be invalidated.
TXG Elliott Wave count: Wave {c} of 4.
TXG Technical Indicators: Above 200EMA
TXG Trading Strategy: Looking for longs into wave 5.
More By This Author:
Elliott Wave Technical Analysis: Shopify Inc.
Elliott Wave Technical Analysis: Monero/U.S. Dollar
Elliott Wave Technical Analysis: Commodity Markets


Comments
Log in or sign up to join the conversation.