Elliott Wave Technical Analysis: Monero/U.S. Dollar
Image Source: Unsplash
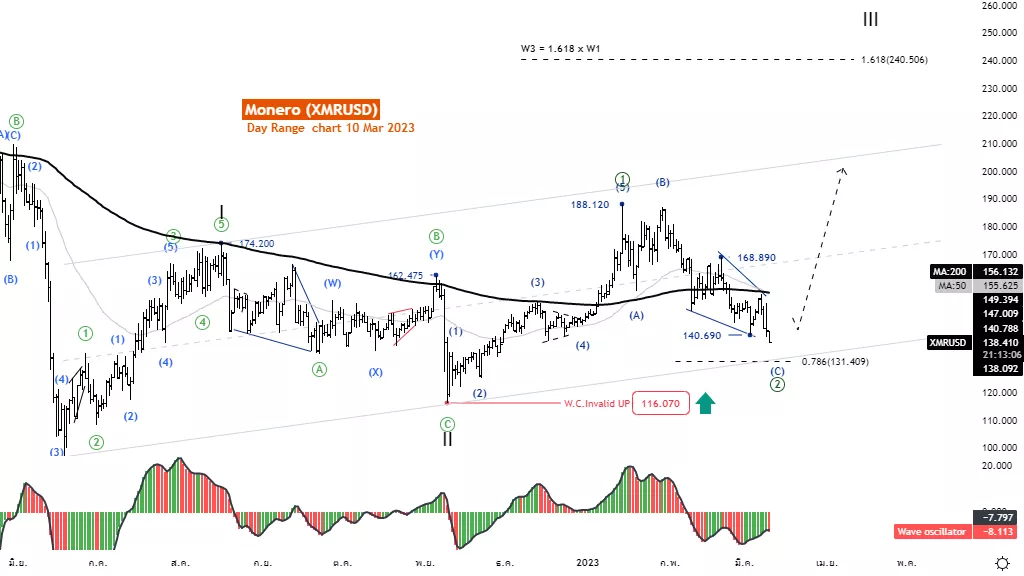
Elliott Wave Analysis TradingLounge Daily Chart, 10 March 2023.
Monero/U.S.dollar(XMRUSD)
XMRUSD Elliott Wave Technical Analysis
Function: Counter trend
Mode: Corrective
Structure: Flat
Position: Wave (C)
Direction Next higher Degrees: Wave ((2)) of Motive
Details: Retracement of wave ((2)) equal to .786 x Length wave ((1)) at 131.409
Wave Cancel invalid Level: 116
Monero/U.S. Dollar (XMRUSD) Trading Strategy: Monero continued to decline from the 188.120 level and descended below the MA200 line, making it a clear downtrend. But even so, the declining price structure is a corrective wave pattern. We still expect a retracement in the second wave. before rising again in the third wave where the level of 116.070 must not be broken to support this idea.
Monero/U.S. Dollar(XMRUSD) Technical Indicators: The price is below the MA200 indicating a downtrend. The wave oscillators below Zero-Line momentum are bearish.
Analyst: Kittiampon Somboonsod

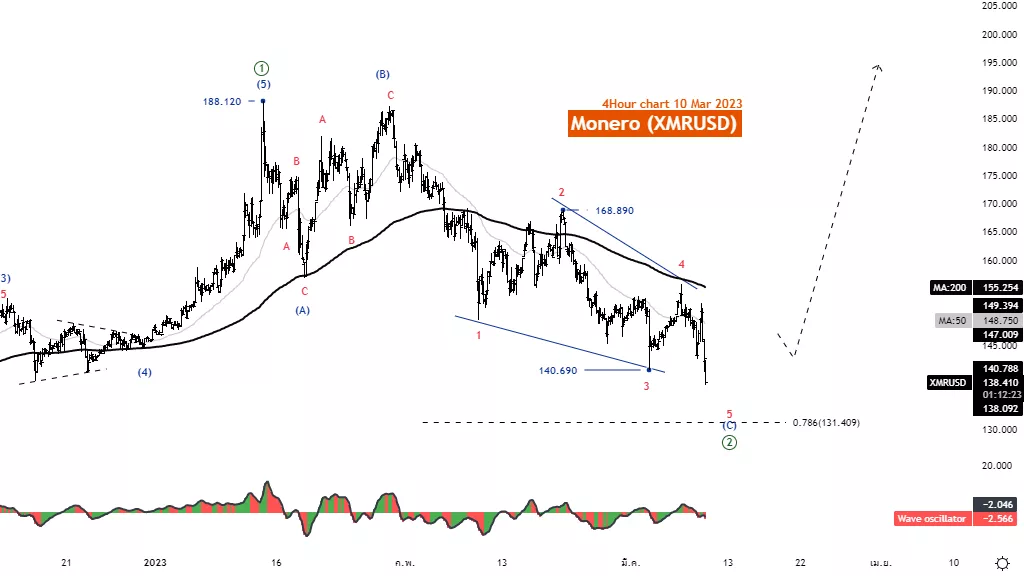
Elliott Wave Analysis TradingLounge 4H Chart, 10 March 2023.
Monero/U.S. Dollar (XMRUSD)
XMRUSD Elliott Wave Technical Analysis
Function: Counter trend
Mode: Corrective
Structure: Flat
Position: Wave (C)
Direction Next higher Degrees: Wave ((2)) of Motive
Details: Retracement of wave ((2)) equal to .786 x Length wave ((1)) at 131.409
Wave Cancel invalid Level: 116
Monero/U.S. Dollar (XMRUSD) Trading Strategy: Monero continued to decline from the 188.120 level and descended below the MA200 line, making it a clear downtrend. But even so, the declining price structure is a corrective wave pattern. We still expect a retracement in the second wave. before rising again in the third wave where the level of 116.070 must not be broken to support this idea.
Monero/U.S. Dollar (XMRUSD) Technical Indicators: The price is below the MA200 indicating a downtrend. The wave oscillators below Zero-Line momentum are bearish.

More By This Author:
Elliott Wave Technical Analysis: U.S. Stocks
Okta Inc. Elliott Wave Technical Analysis 9 March 23
Elliott Wave Trading: Thursday, March 9 - SP500 - Nasdaq - Russell 2000 - Dow Jones
Disclosure: As with any trading or investment opportunity there is a risk of making losses especially in day trading or investments that Trading Lounge expresses opinions on. Note: Historical ...
more


