

Hello Everyone! In this technical blog, we are going to take a look at the Elliott Wave path in the 20 Year Bond ETF ($TLT).
The iShares 20+ Year Treasury Bond ETF seeks to track the investment results of an index composed of U.S. Treasury bonds with remaining maturities greater than twenty years.
$TLT 4H Elliott Wave Analysis Feb 12 2023:
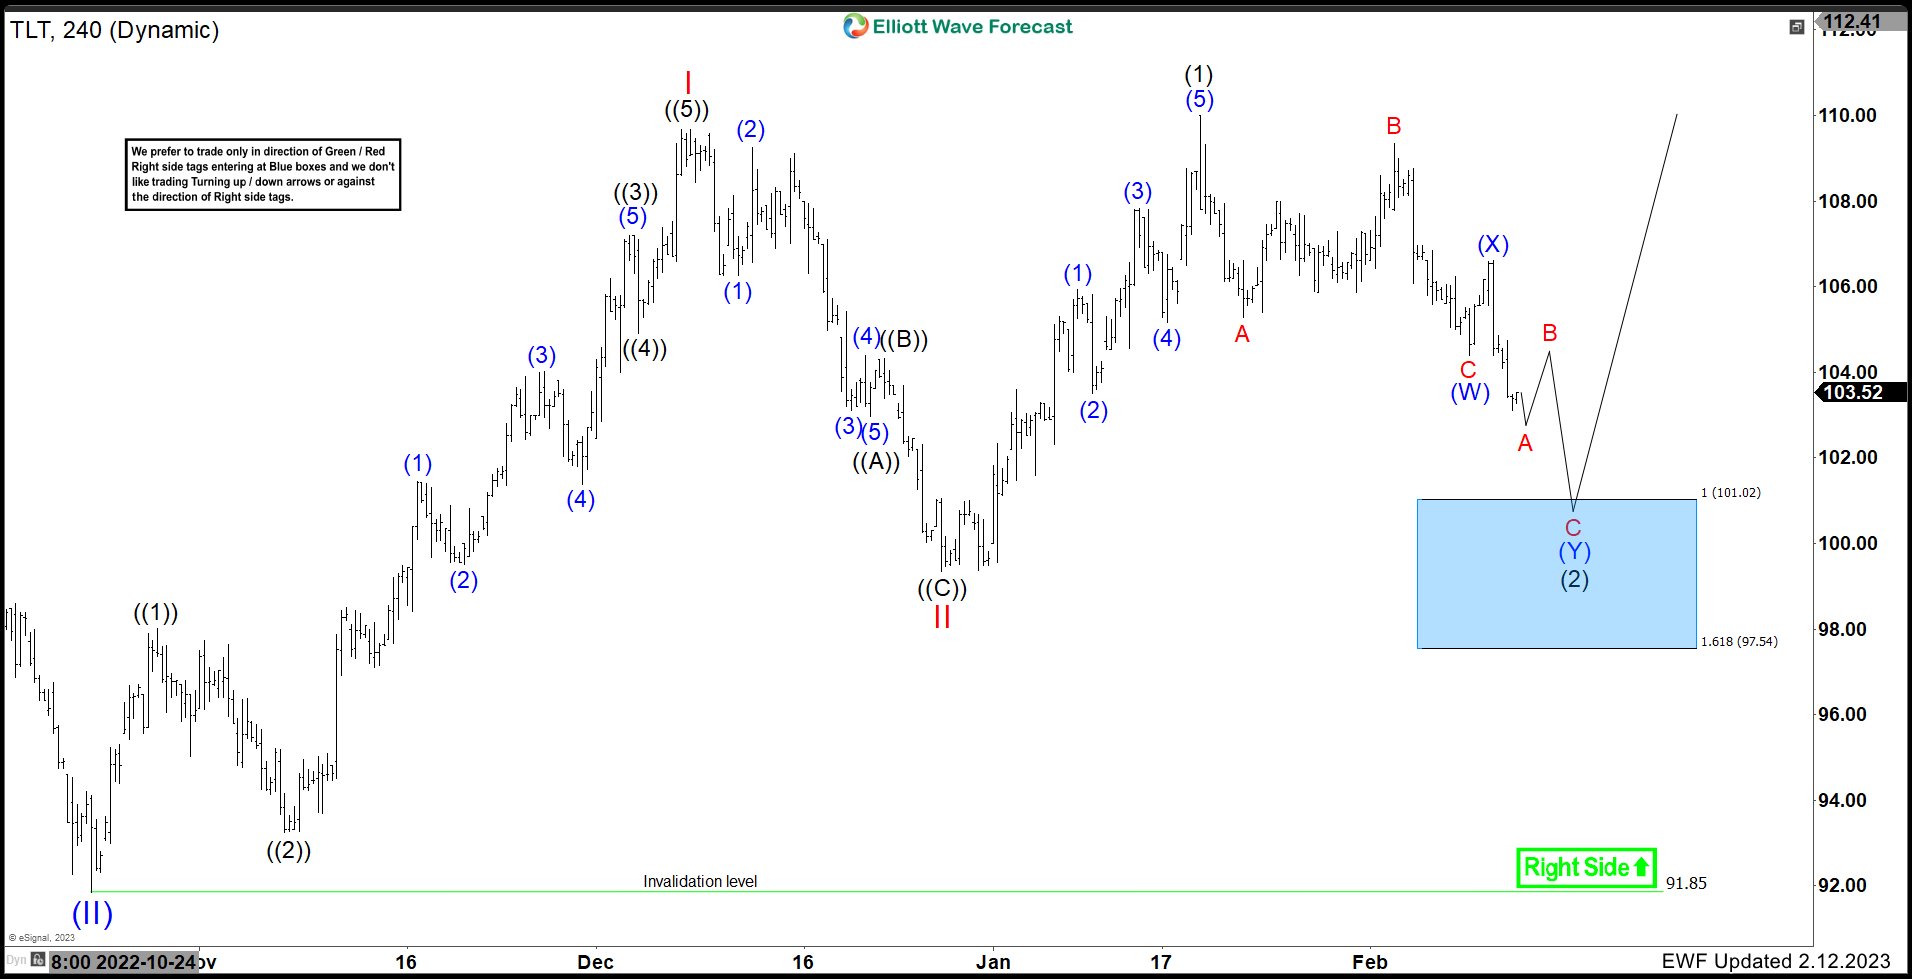
The 4H chart above is showing the path in $TLT since Oct 2022 lows. The ETF is favoured to have struck a low at $91.85 and bounced in 5 waves. After completing the 5 waves, a pullback to correct that cycle took place and ended at red II. Since that low, another 5 wave rally took place and broke above the red I peak creating a bullish sequence. So far, the cycle from Dec lows ended and a 7 swing (WXY) pullback is taking place. Due to the bullish sequence and as long as the lows at $91.85 hold, we expect buyers to appear at the Blue Box area at 101.02 - 97.54.



Comments
Log in or sign up to join the conversation.