

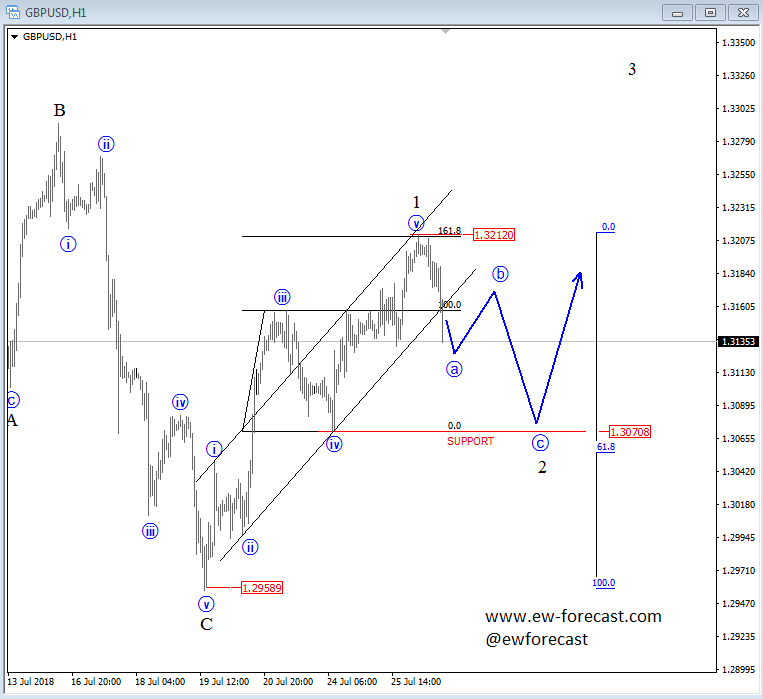
Let's take a look on intra-day GBP/USD chart and let's see how it looks from Elliott Wave perspective.
Cable made impulsive five waves up from 1.2958 lows, which suggest a bullish reversal, at least temporary and short-term. As we know, in EW theory, after every five waves a three-wave pullback follows.
So, we are tracking a three-wave a-b-c correction back to around 61,8% Fibonacci retracement and previous wave iv, where ideal support area would be around 1.3070 level, from where we may see a bounce and a bullish continuation towards 1.33 – 1.34 region.
Even if correction goes more complex, we will remain bullish as long as it's trading above 1.2958 invalidation level.
GBP/USD, 1H



Comments
Log in or sign up to join the conversation.