


In this technical blog, we will look at the past performance of the Daily Elliott Wave Charts of XME. In which, the rally from July 2022 low ended in an impulse sequence & showed higher high sequence in weekly structure therefore, called for an extension higher to take place. We knew that the structure in XME should remain supported & extend higher. So, we advised members not to sell the ETF & buy the dips in 3, 7, or 11 swings at the blue box areas. We will explain the structure & forecast below:
XME Daily Elliott Wave Chart From 3.22.2026
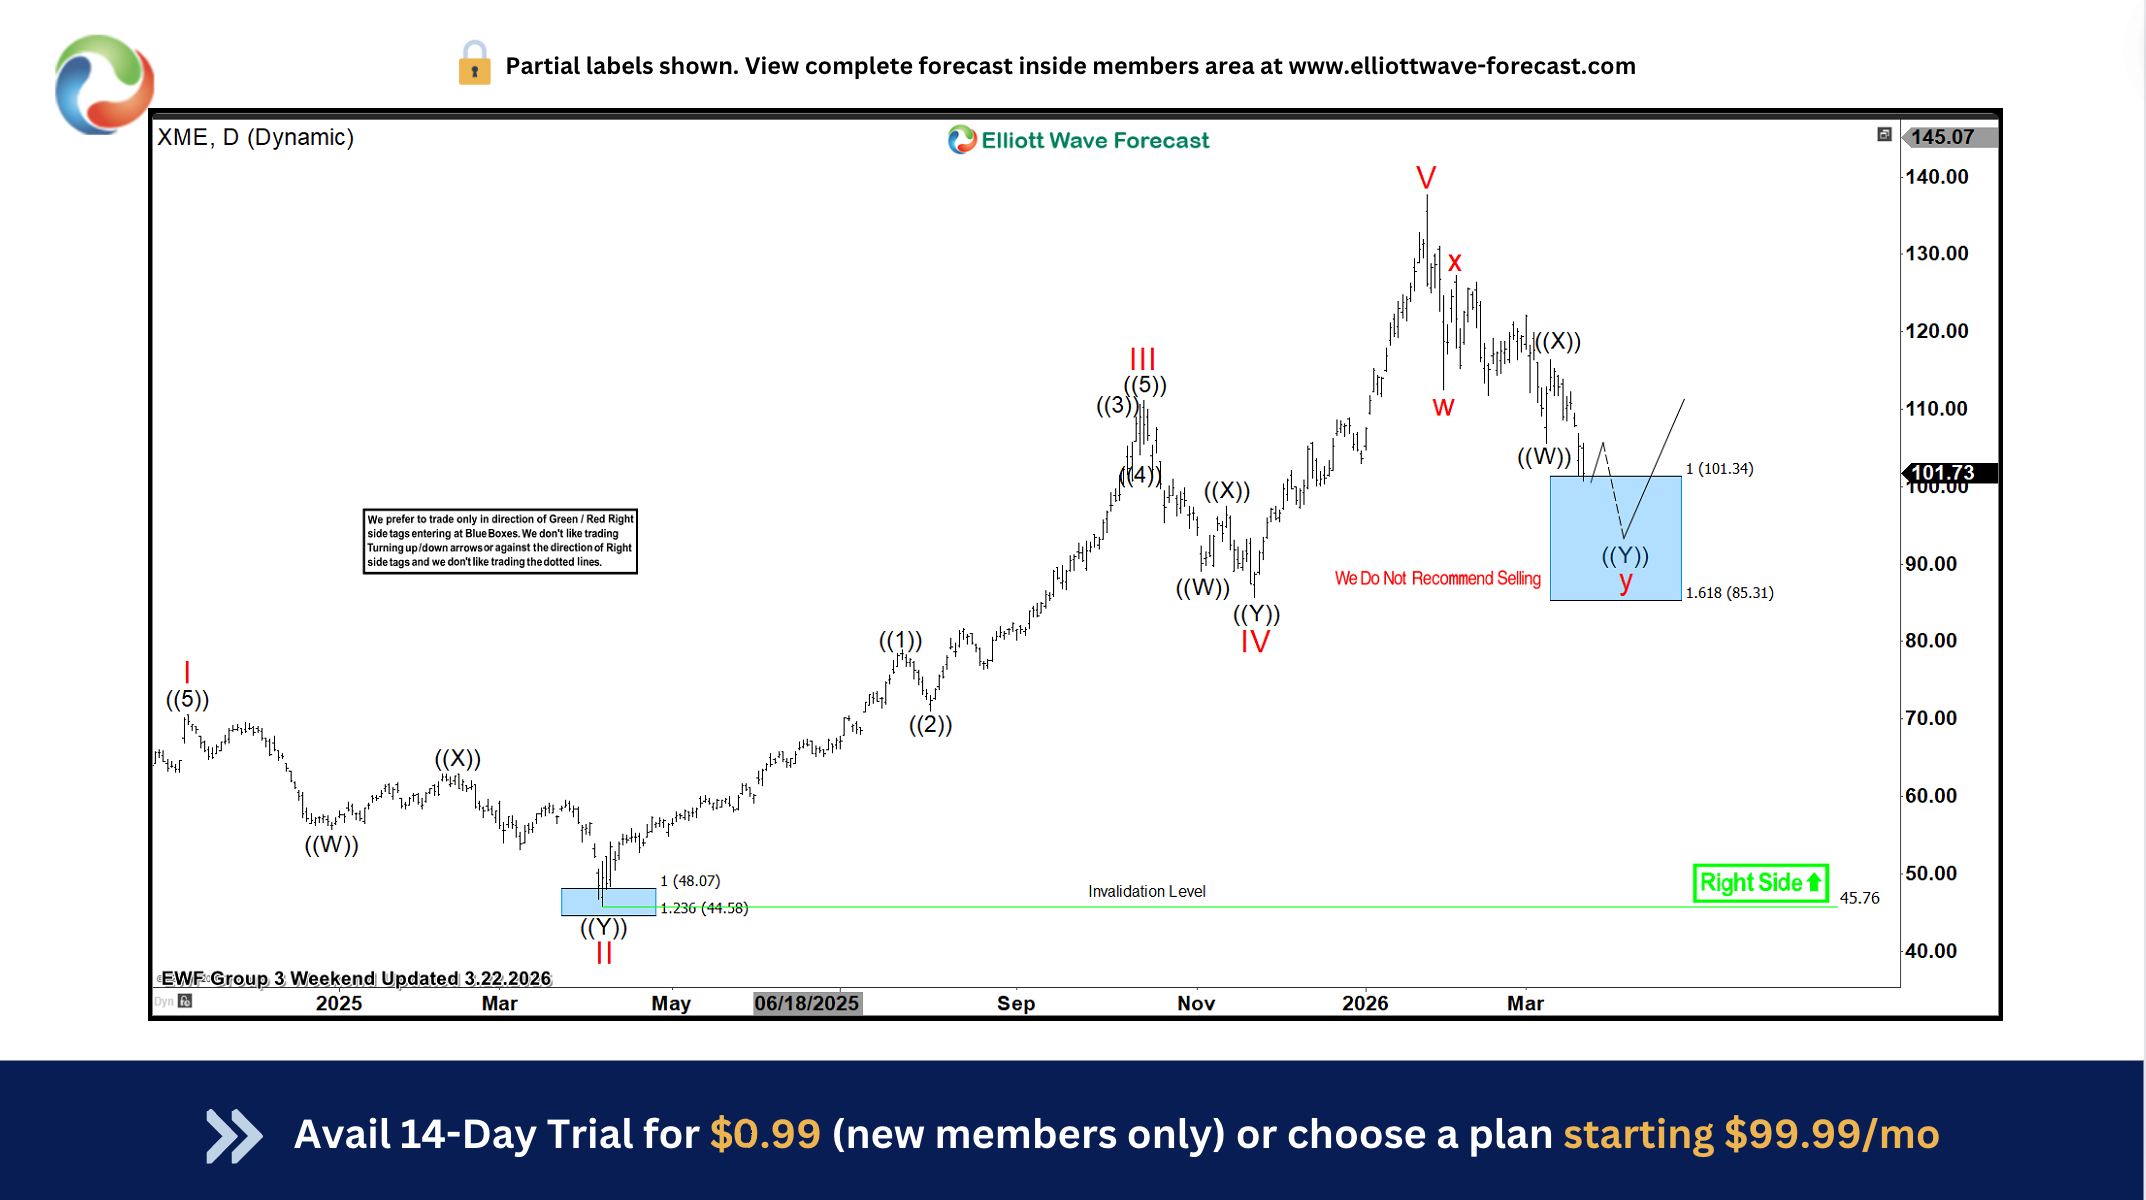
Here’s the Daily Elliott wave Chart from the 3.22.2026 Weekend update. In which, the rally to $135.68 high completed the cycle from July 2022 low & made a pullback against that cycle. The internals of that pullback unfolded as Elliott wave double three correction where wave w ended at $117.14 low. A rally to $126.45 high-ended wave x bounce. Then started the next leg lower in wave y towards $101.34- $85.31 blue box area. From there, buyers were expected to appear looking for new highs ideally or for a 3-wave bounce minimum.
XME Latest Daily Elliott Wave Chart From 5.24.2026
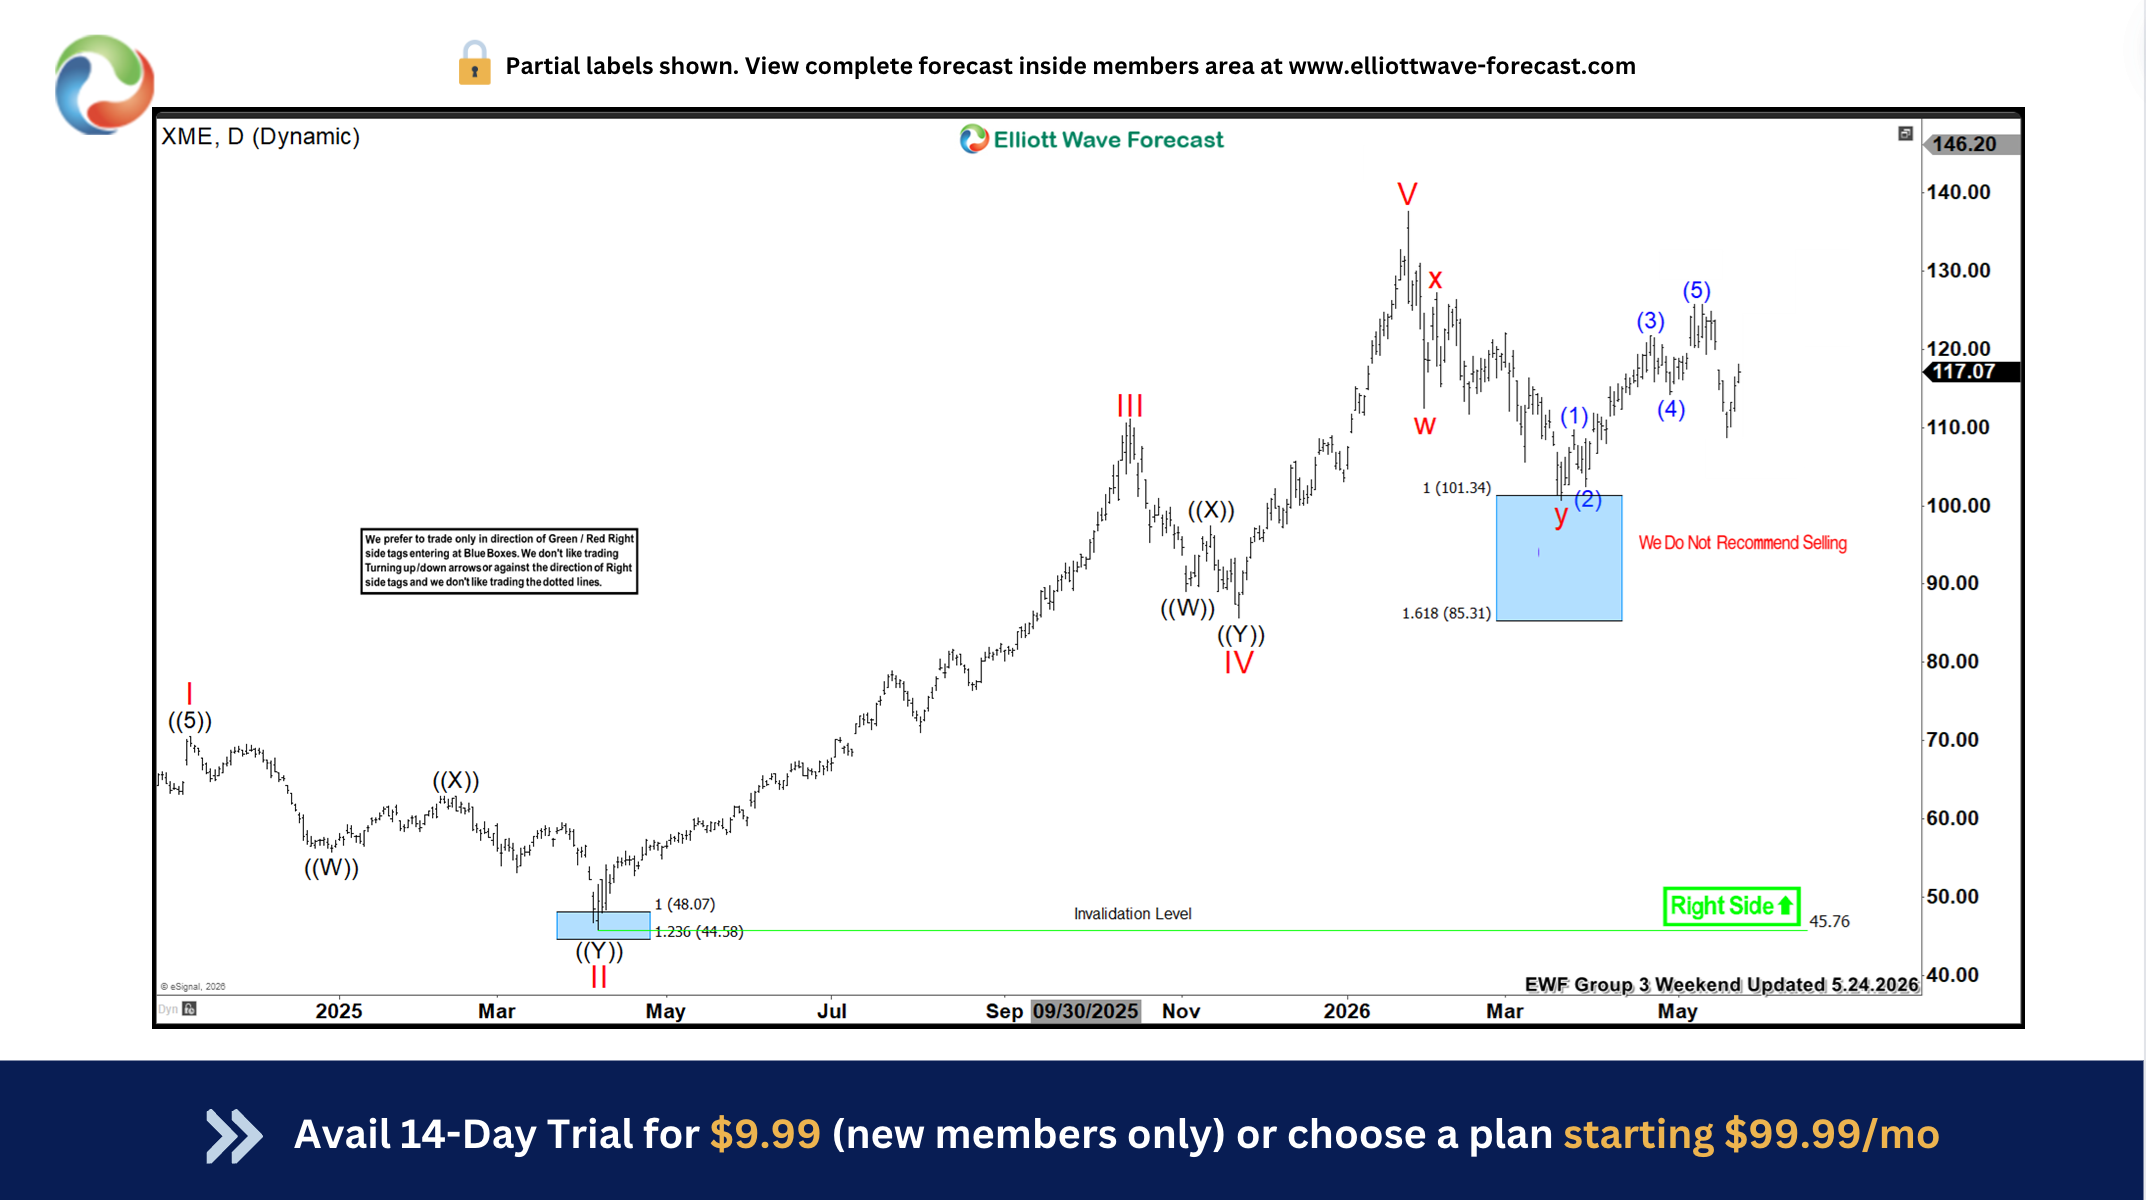
This is the latest Daily Elliott wave Chart from 5.24.2026 Weekend update. In which the XME is showing a very strong reaction higher taking place, right after ending the double correction within the blue box area. Allowed members to create a risk-free position shortly after taking the long position at the blue box area. However, a break above $135.68 high is needed to confirm the next leg higher targeting $146.57- $160.75 area minimum.



Comments
Log in or sign up to join the conversation.