

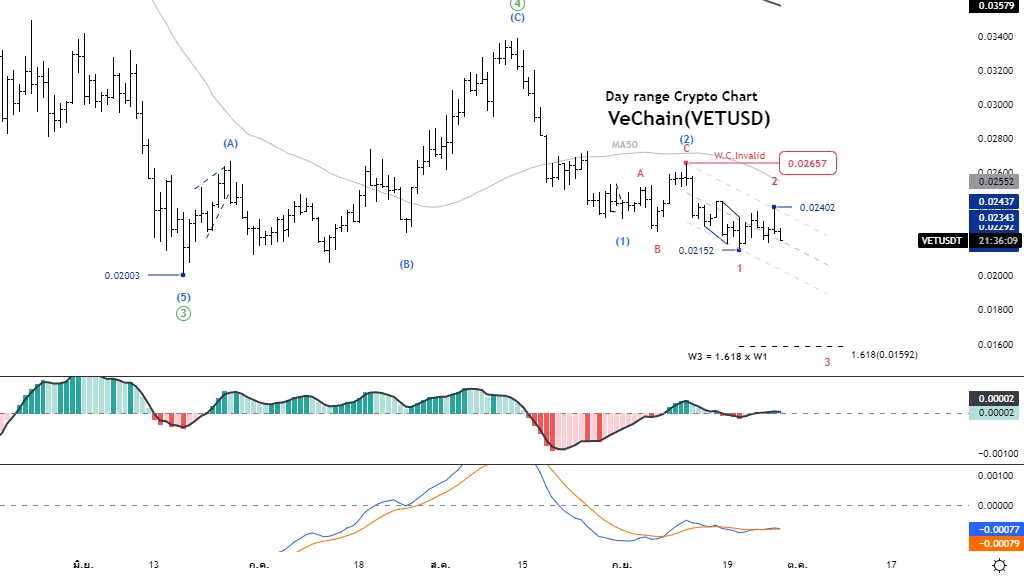
Elliott Wave Analysis TradingLounge Daily Chart, 28 September 2022,
VeChain (VET-X)

VETUSD Elliott Wave Technical Analysis
Function: Follow trend
Mode: Motive
Structure: Impulse
Position: Wave 3
Direction Next higher Degrees: wave (3) of Motive
Details: The price tends to trade lower. 0.2003, but must not return no more than 0.02402
Wave Cancel invalid Level: 0.02657.
VeChain Trading Strategy: Bear Market Efforts The price tends to trade
below the 0.2003 level, and it tends to go down to the 0.0159 level. This could be an
opportunity to open a short position.
VeChainTechnical Indicators: MACD is below 0 line, price is below MA50,MA200 line, trend is still bearish.
Tradinglounge Analyst : Kittiampon Somboonsod
VeChain
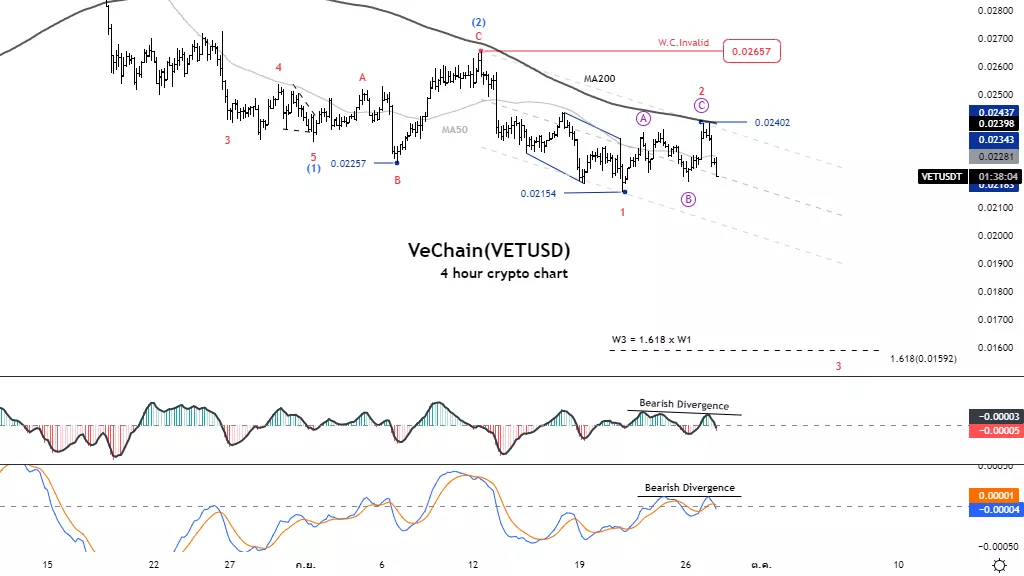
VETUSD Elliott Wave Technical Analysis
Function: Follow trend
Mode: Motive
Structure: Impulse
Position: Wave 3
Direction Next higher Degrees: wave (3) of Motive
Details: The price tends to trade lower. 0.2003, but must not return no more than 0.02402
Wave Cancel invalid Level: 0.02657.
VeChain Trading Strategy: Bear Market Efforts The price tends to trade
below the 0.2003 level, and it tends to go down to the 0.0159 level. This could be an
opportunity to open a short position.
VeChainTechnical Indicators: MACD and MACD Histogram has a Bullish divergence, and the price has an opportunity reversal.
More By This Author:
DAX 40 Index Chart And Forecasts Elliott Wave
CostCo Wholesale Corp.(COST:NASDAQ) Elliott Wave Technical Analysis September 27 2022
Bitcoin Elliott Wave BTC Bounce To $21,000



Comments
Log in or sign up to join the conversation.