

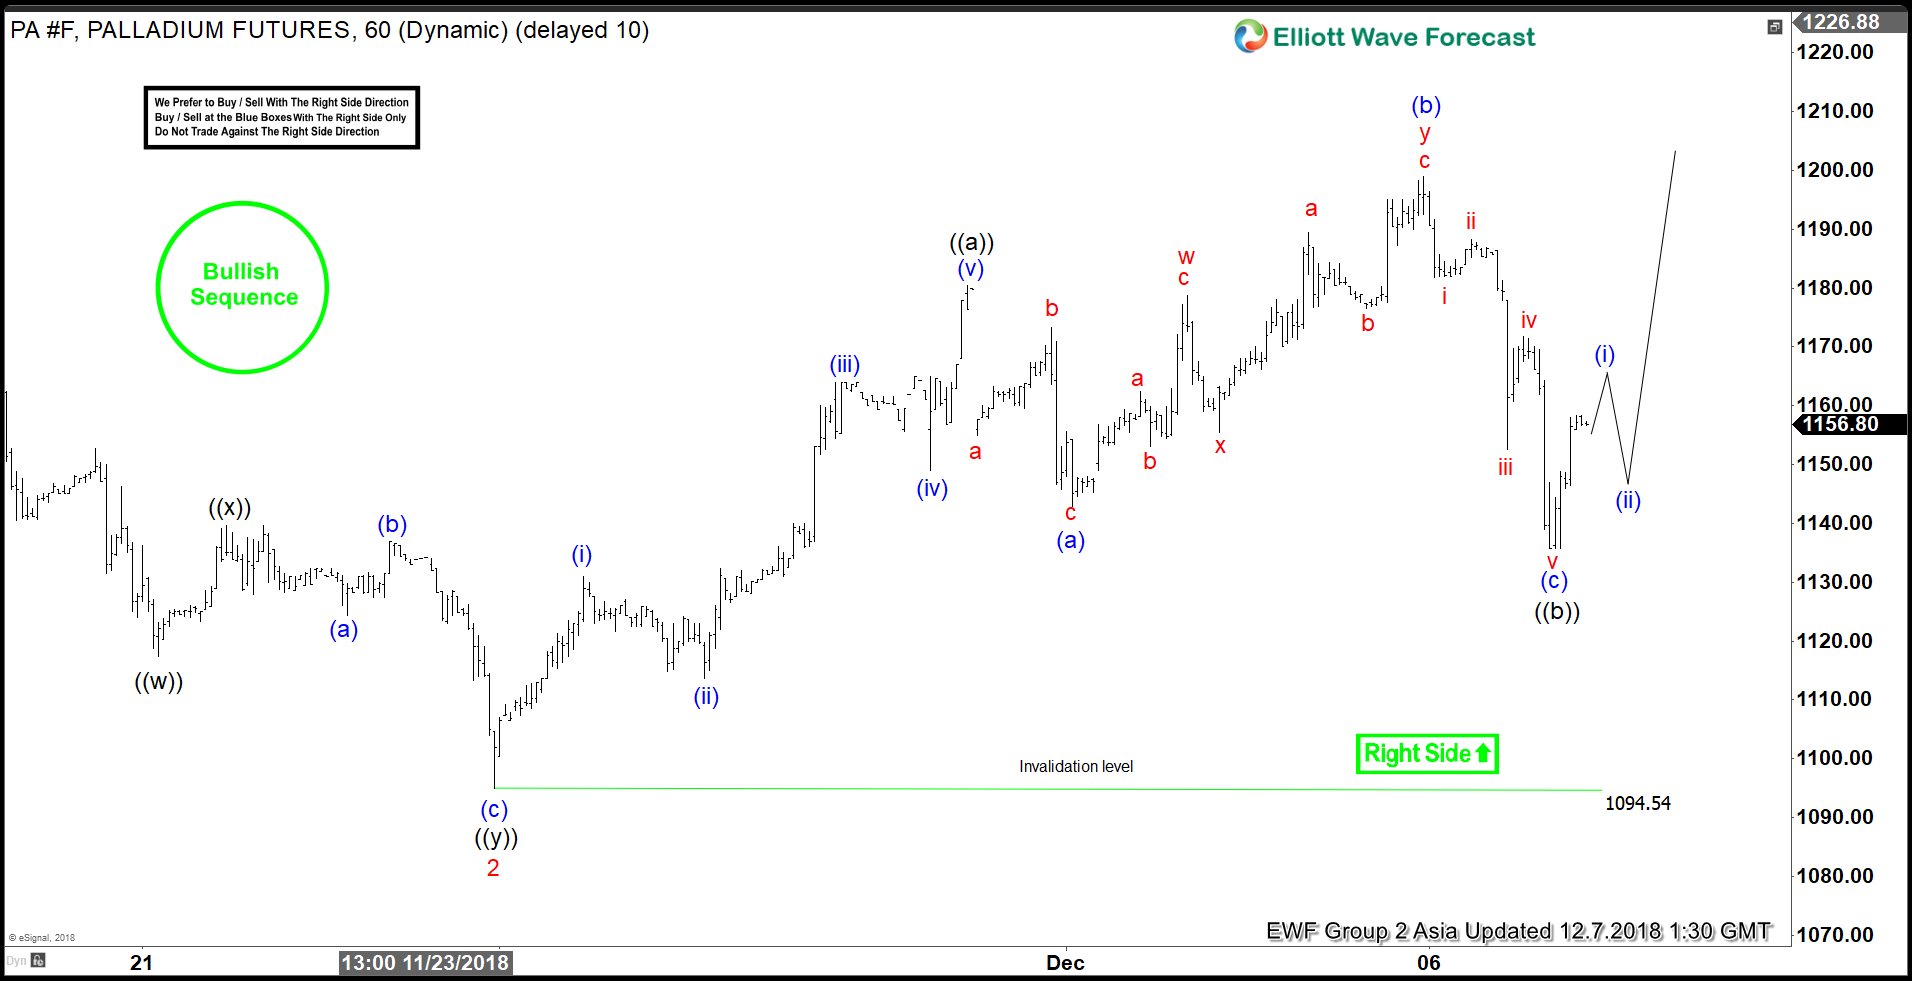
Below, you can see the 1-hour updated chart posted on the 12/07/18 with our Elliot count perspective at the time. We expected prices to extend higher due to the 11/16 high broken on 11/29, hence our bullish sequence stamp. Under our method, we encourage our members to trade with the right side of the market after a 3,7, or 11 swing dip. Usually, said dip, corrects the latest completed bullish cycle. With this in mind, after a FLAT correction (a 3 swing dip) of the cycle from 11/23 to wave ((a)), we expected a bullish reaction. As long as the invalidation level (1094.54) was kept intact, and the dip reached anywhere within the 1-1.618 Fibonacci extension area of blue (a) & (b), we expected buyers for further upside.
Palladium 12.07.2018 1 Hour Chart Elliott Wave Analysis
Notice what happens when the metal reaches the expected reaction area of (1150-1120). Palladium makes a great bounce and starts extending higher. A 5 wave impulse wave move towards new highs as long as the 1094.71 pivot holds.
Palladium 12.13.2018 1 Hour Chart Elliott Wave Analysis
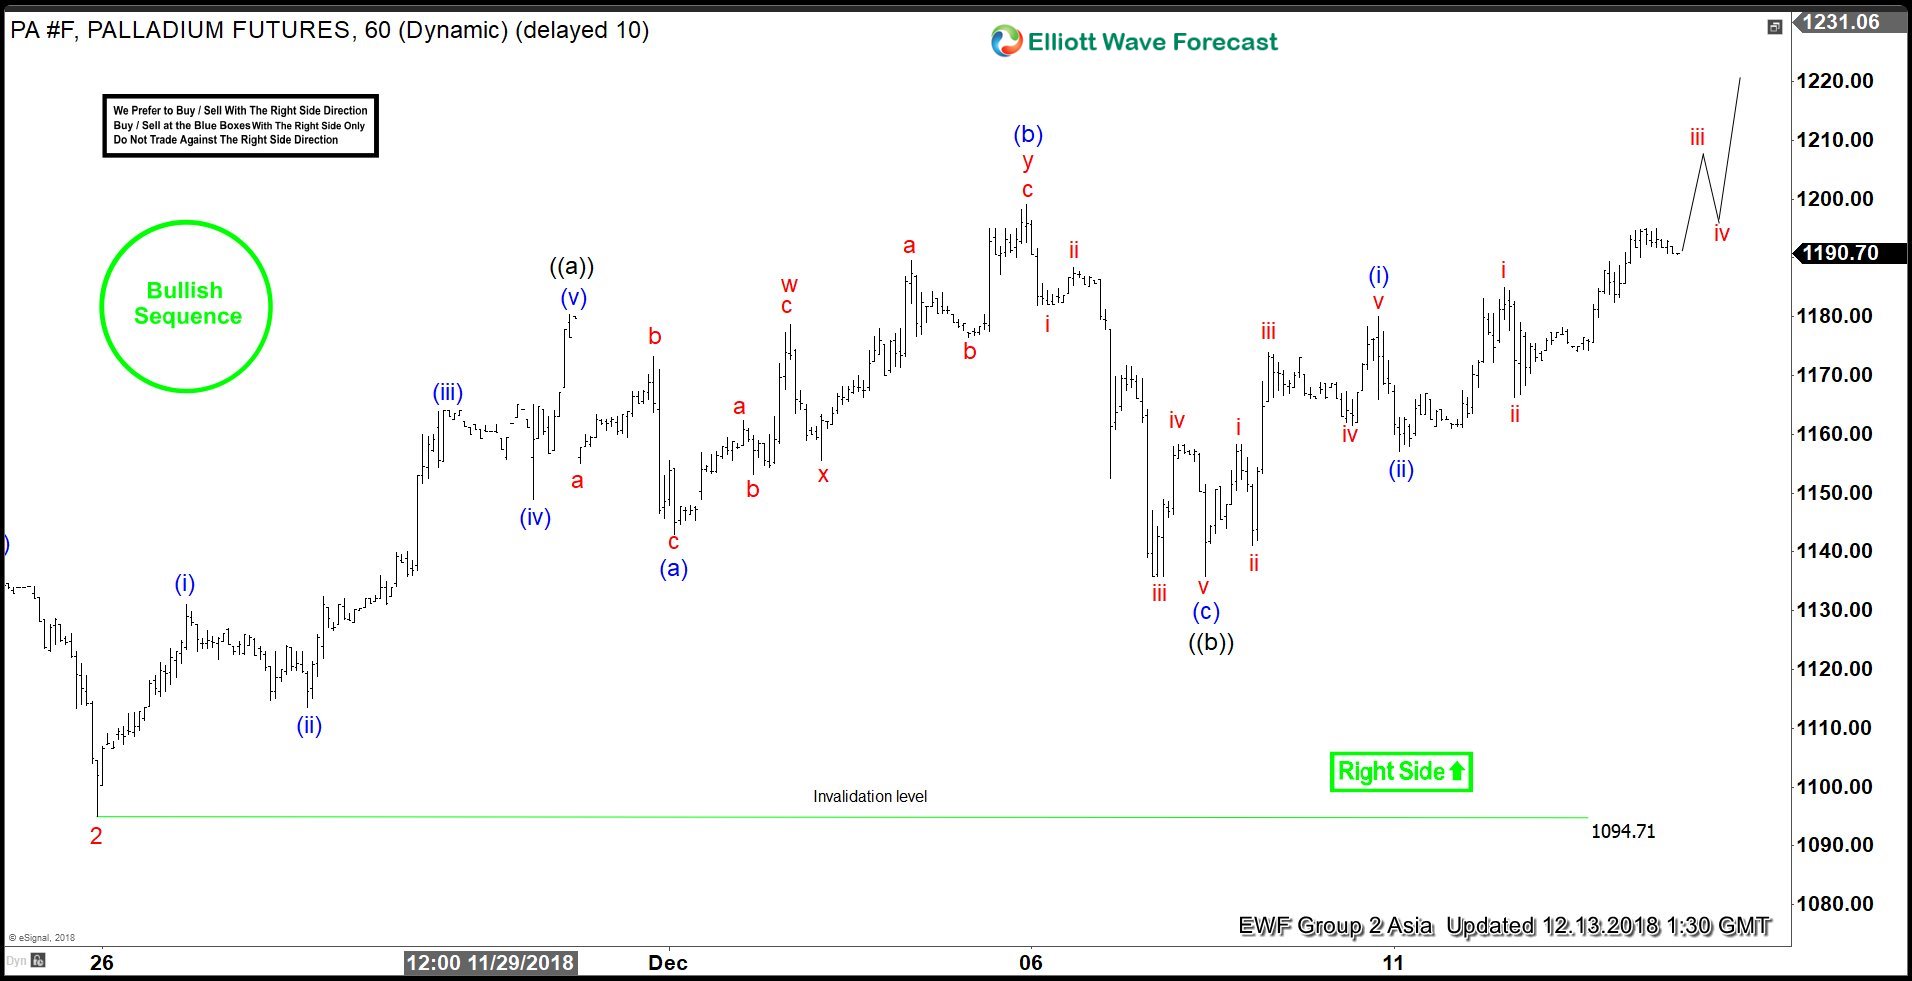
*Note : Keep in mind the market is dynamic and the presented view might have changed after the post was published.



Comments
Log in or sign up to join the conversation.