

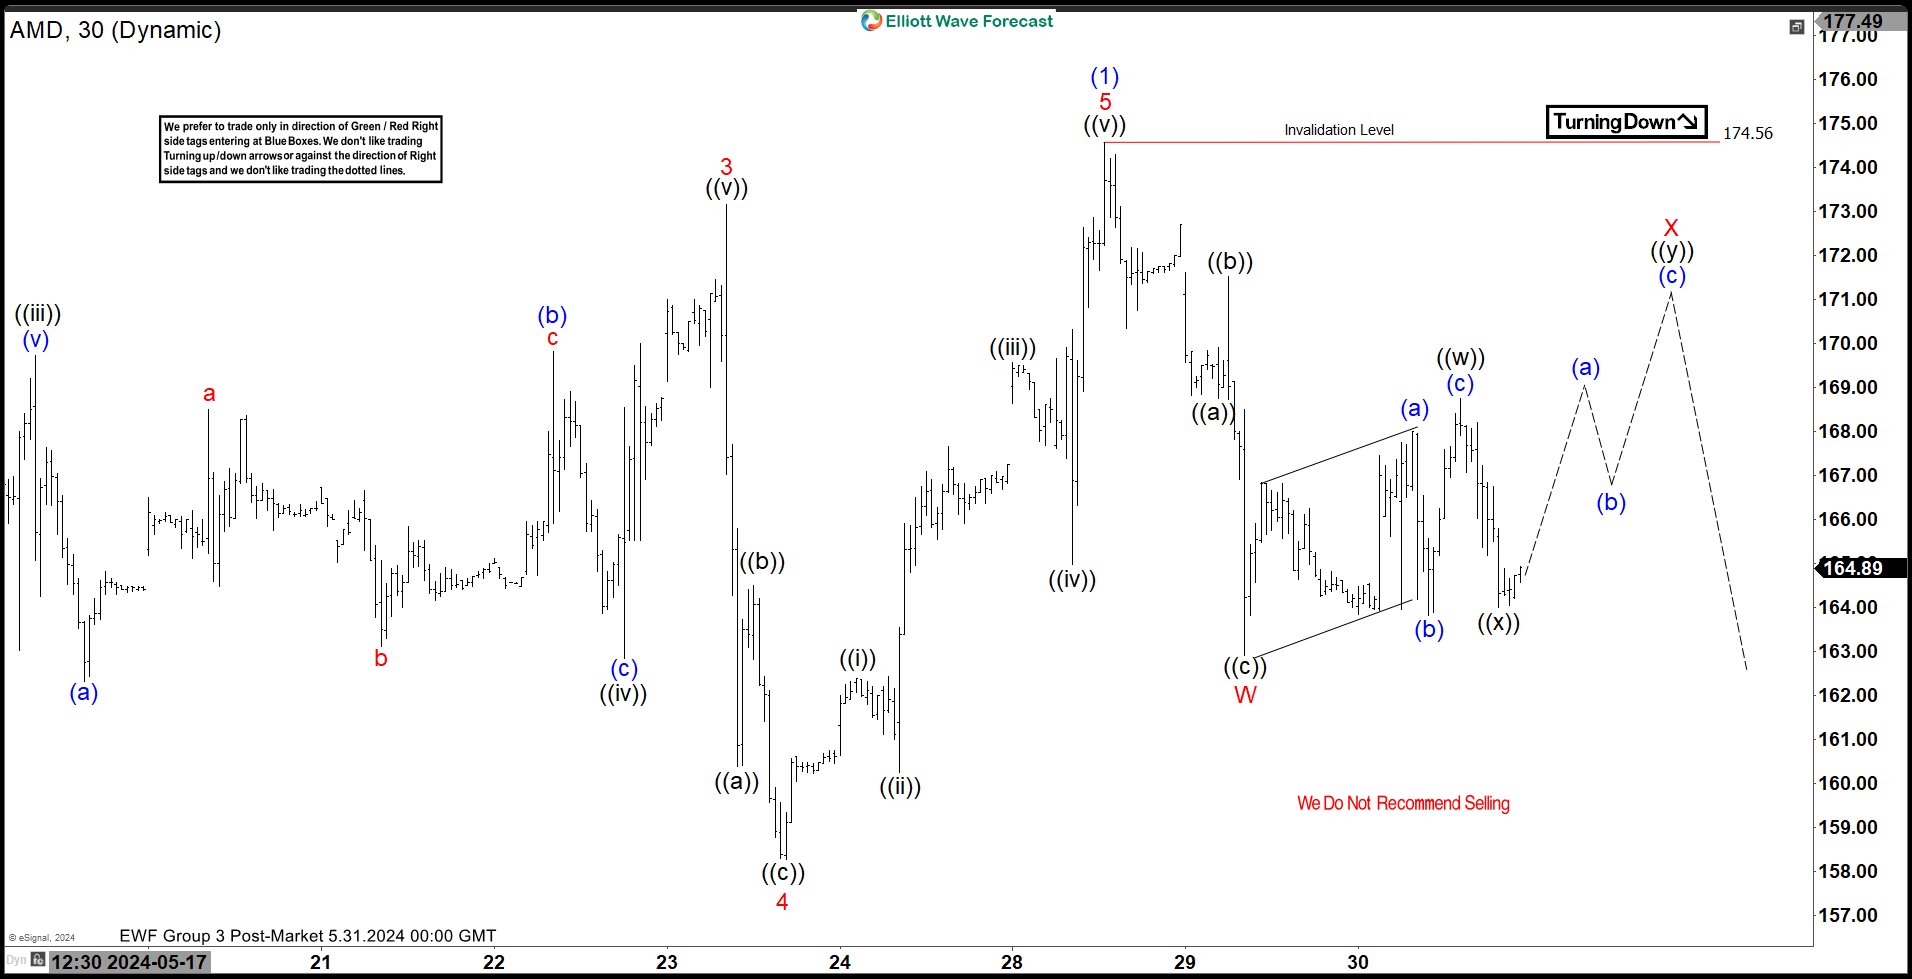
Short Term Elliott Wave in AMD suggests the rally from 5.01.2024 low is in progress as an impulse. Up from 5.01.2024 low, wave (1) ended at 174.56 as the 30 minutes chart below showing. Wave (2) pullback is currently in progress. The internal subdivision of wave (2) takes the form of a double three Elliott Wave structure. Down from wave (2), wave ((a)) ended at 168.75 low and wave ((b)) bounce ended at 171.51. The stock extended lower in wave ((c)) towards 162.91 which completed wave W.
The market rallied starting wave X also taking the form of a double three Elliott Wave structure. Up from wave W, wave ((w)) ended at 168.75 and pullback in wave ((x)) ended at 164.00. Wave ((y)) higher is in progress. We are looking a bounce in 3 swings to 169.88 - 173.51 area to end wave ((y)) and also wave X connector. Near term, as far as pivot at 174.56 high stays intact, expect the stock to extend lower.
AMD 30 Minutes Elliott Wave Chart



Comments
Log in or sign up to join the conversation.