


Eli Lilly & Company (LLY) discovers, develops & markets human pharmaceuticals worldwide. It comes under the Healthcare sector & trades at NYSE.
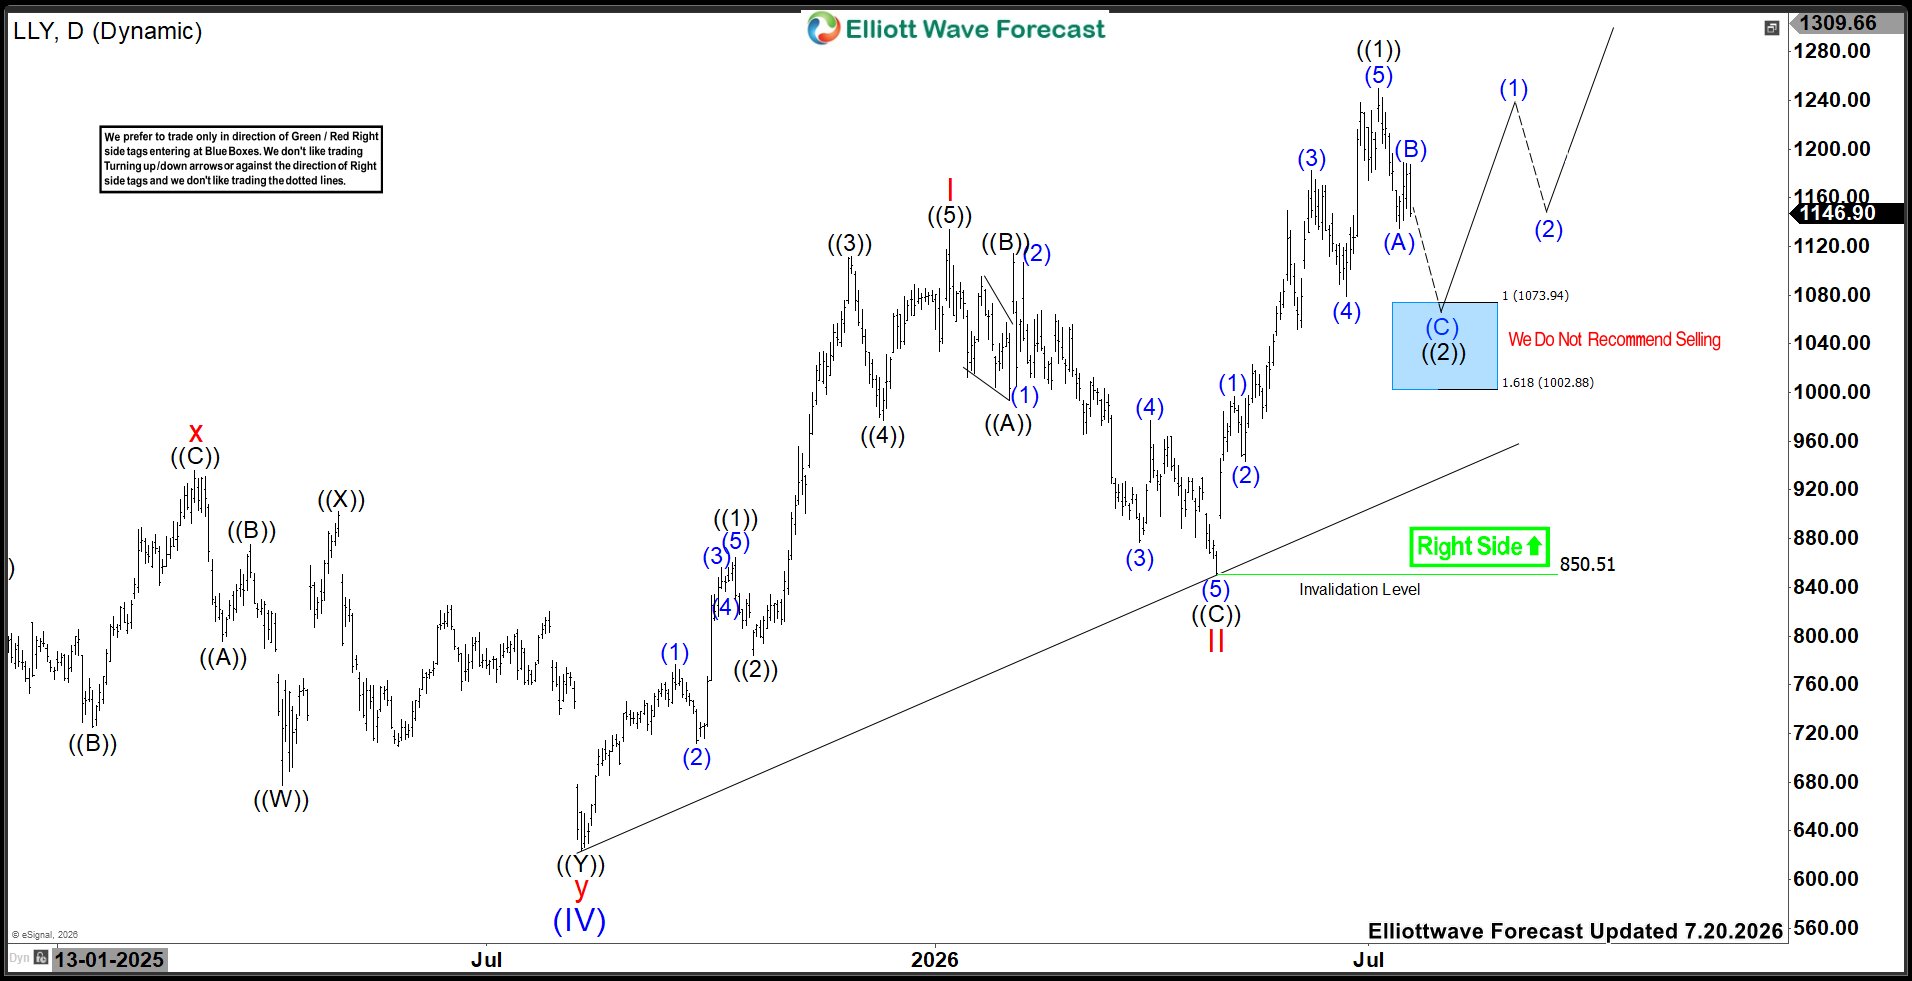
LLY favors a corrective pullback in ((2)) against the 4.29.2026 low before continuing the rally in the bull sequence of III. The buyers should look for the next opportunity between $1073.94 – $1002.88 area to extend in ((3)).
LLY – Elliott Wave Latest Daily View:
In the weekly chart, it favors a bullish impulse sequence as trading to ATH. It placed (II) at $64.18 low in November 2016, (III) at $937.96 high in August-2024 & (IV) at $623.78 low in August-2025 low. Within (III), it placed I at $129.48 high, II at $101.36 low, III at $966.10 high, IV at $775.81 low & V at $937.96 high. The wave III of (III) was an extended nested wave showing the highest momentum. The (IV) pullback was a double correction. It placed w at $711.40 low, x at $935.63 high & y at $623.78 low. Each degree was further subdivided in 3 or 7 swings. Above $623.78 low, it placed ((1)) of I at $776.96 high, ((2)) at $712.05 low, ((3)) at $1111.99 high, ((4)) at $977.12 low & ((5)) at $1133.95 high.
LLY – Elliott Wave View From 6.10.2026:
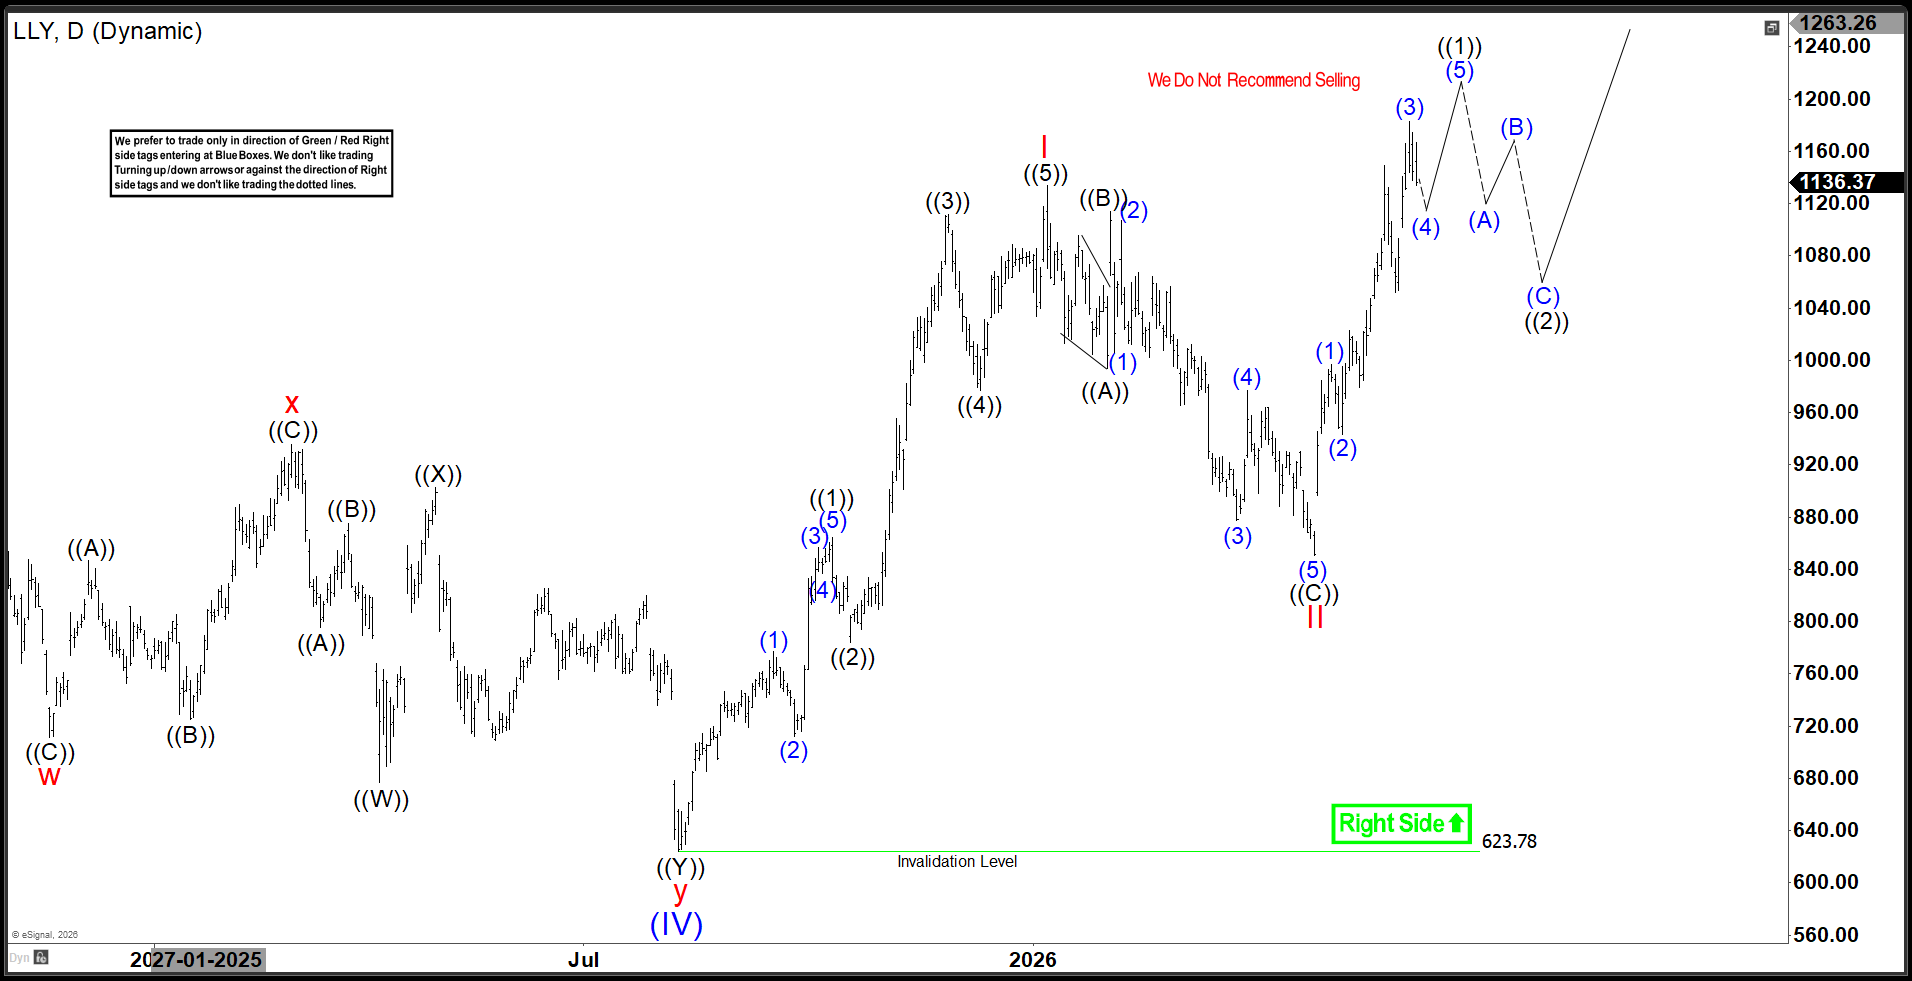
It ended II in extended zigzag correction, where ((A)) at $993.58 low, ((B)) at $1114 high & ((C)) at $850.51 low. It already ended ((1)) of III at $1249.45 high against 4.29.2026 low & favors pullback in ((2)). Within ((1)), it ended (1) at $996.49 high, (2) at $943.26 low, (3) at $1182.73 high, 1079.22 low & (5) at $1249.45 high. Within ((2)) pullback, it ended (A) at $1134.40 low & appears to have ended (B) at $1189.07 high. Below there, it expects downside into $1073.94 – $1002.88 area to finish ((2)), which confirms below $1134.40 low. But if it breaks above $1189.07 high, it can do double in (B) in alternate view before turning lower. We like to buy the pullback in extreme area in (C) against April-2026 low for next rally above $1362 or higher.
LLY – Elliott Wave Latest Weekly View:
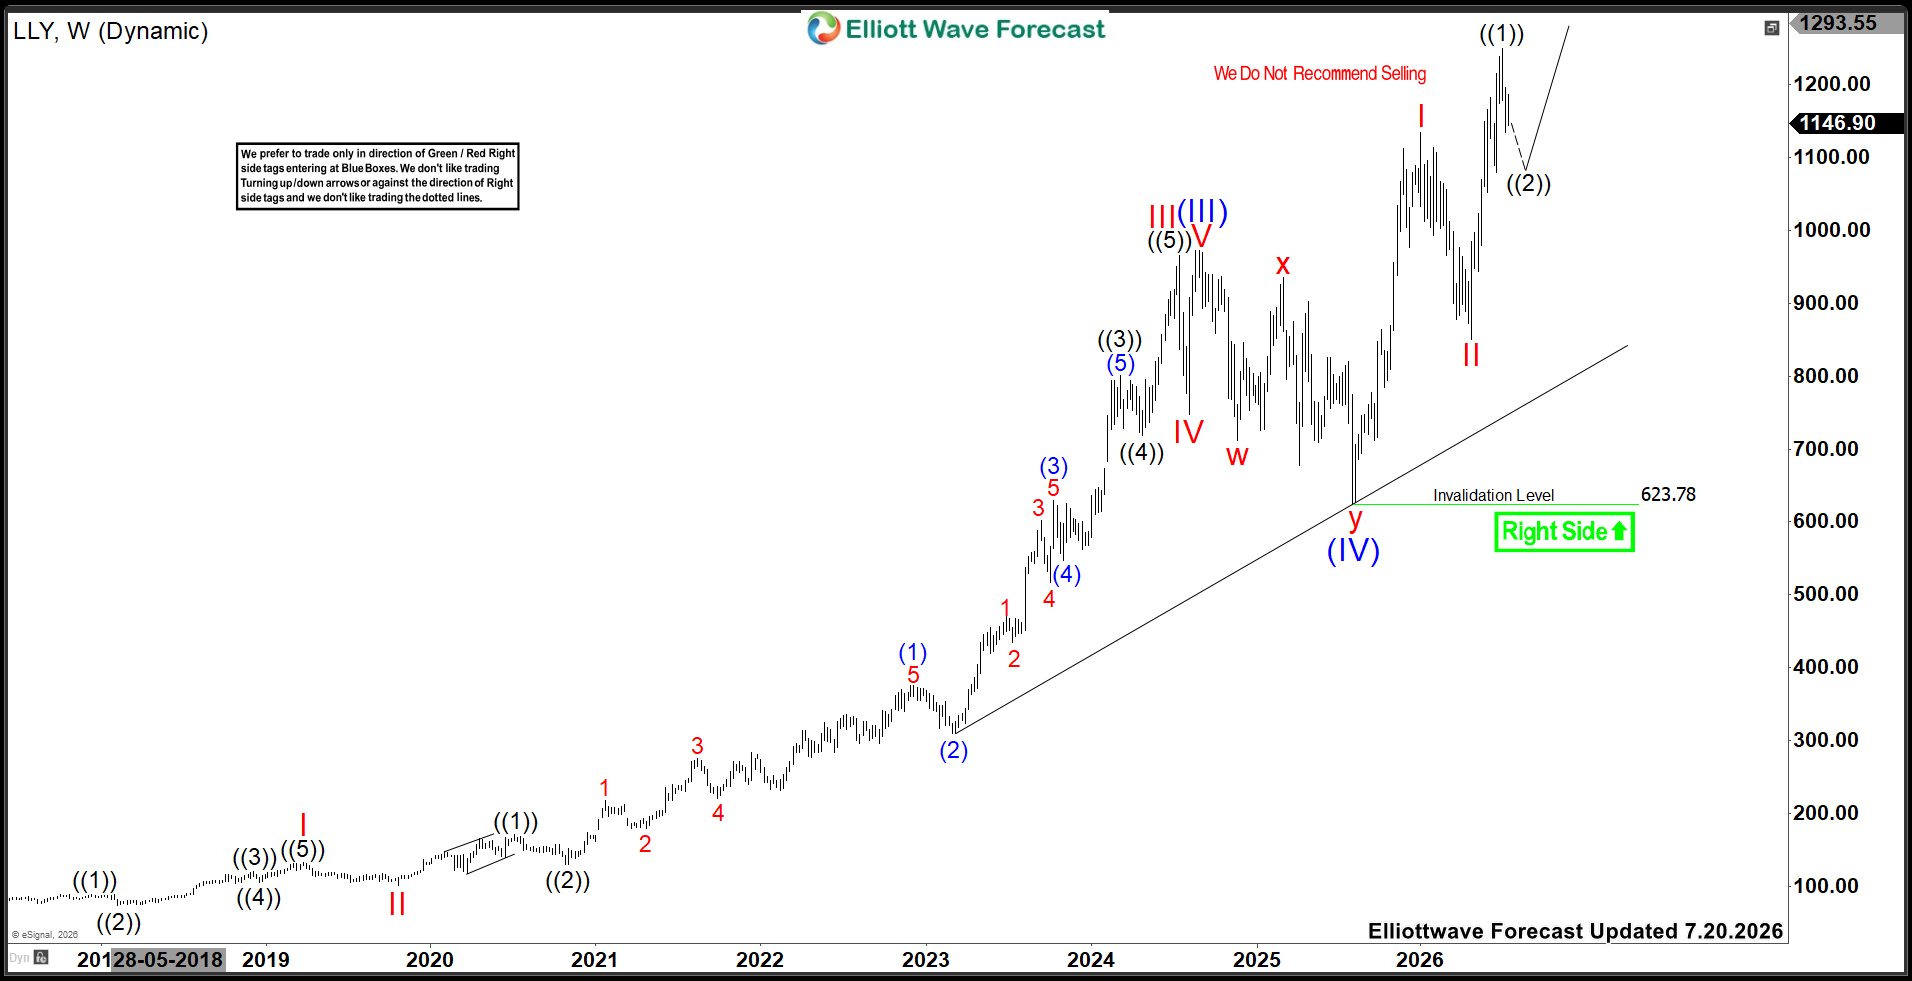
Further rally in ((3)) will confirm when it manages to erase the momentum divergence after breaking above July-2026 peak. Alternatively, it can do a diagonal in I sequence with a new high from the August-2025 high before correcting lower in II, which later breaks below the current pullback low. In either case, buyers can look for a buy in a clear 3, 7, or 11 swing pullback at the extreme area.



Comments
Log in or sign up to join the conversation.