
Prospects for higher short rates are kind of taking a toll on equity indices that until recently were pricing in monetary easing this year. The elevated investor optimism has taken a hit but is nowhere near done in the big scheme of things.
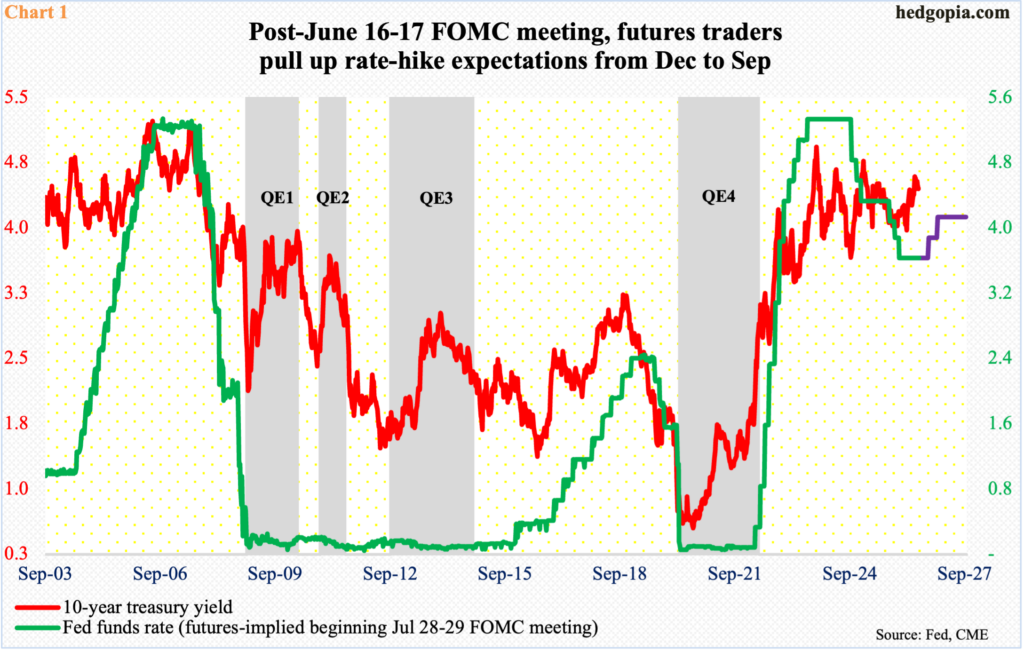
Newly appointed Federal Reserve Chairman Kevin Warsh was vindicated last week. No sooner than he uttered “this committee will deliver price stability” at the end of a two-day FOMC meeting on the 17th than May’s PCE (personal consumption expenditures) inflation released on the 25th showed price pressures were continuing to build.
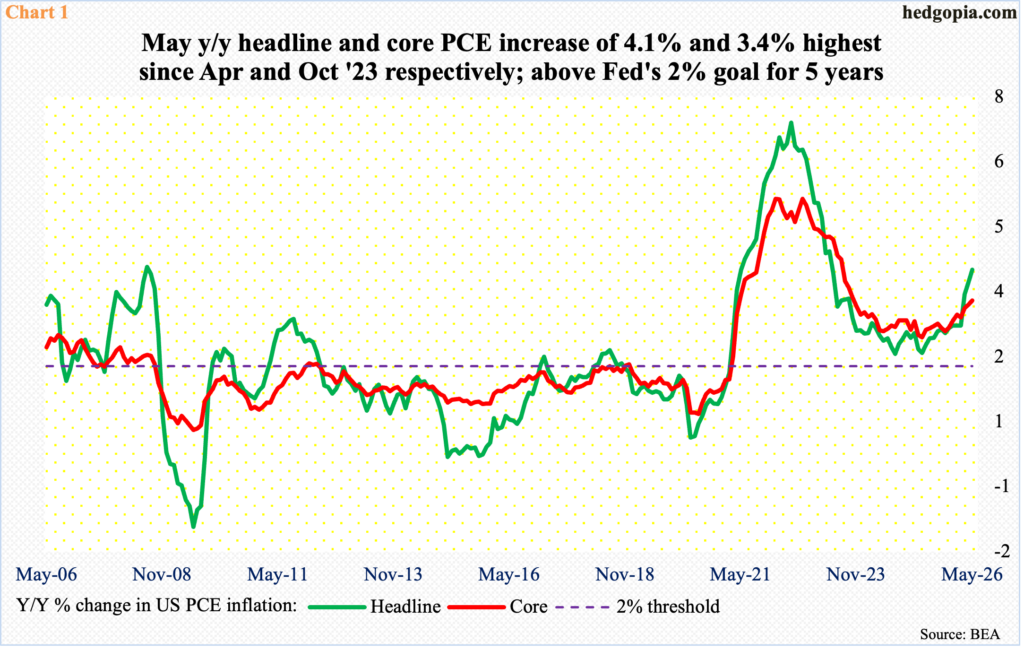
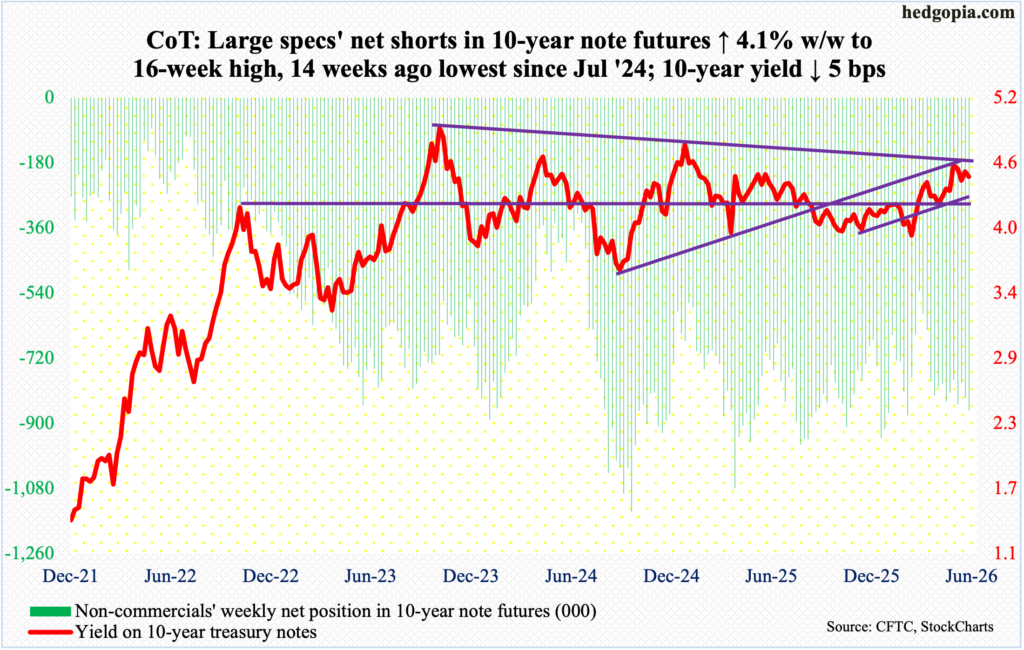
From a year ago, headline and core PCE in May respectively grew 4.1 percent and 3.4 percent, which was the largest increase since April and October 2023. It is true that the war in Iran, and the resultant upward pressure on oil prices, has contributed to inflation. But it is also true that headline and core PCE respectively bottomed in April last year at 2.3 percent and 2.6 percent. Iran was attacked by the U.S. and Israel on February 28 this year.
Inflation has remained north of the central bank’s stated goal of two percent for five years now (Chart 1).
Most recently, the AI (artificial intelligence) boom has not helped, helping drive up the cost to produce electronic devices thanks to an acute shortage of memory. Both Apple (AAPL) and Microsoft (MSFT) last week announced price hikes on a whole host of devices.
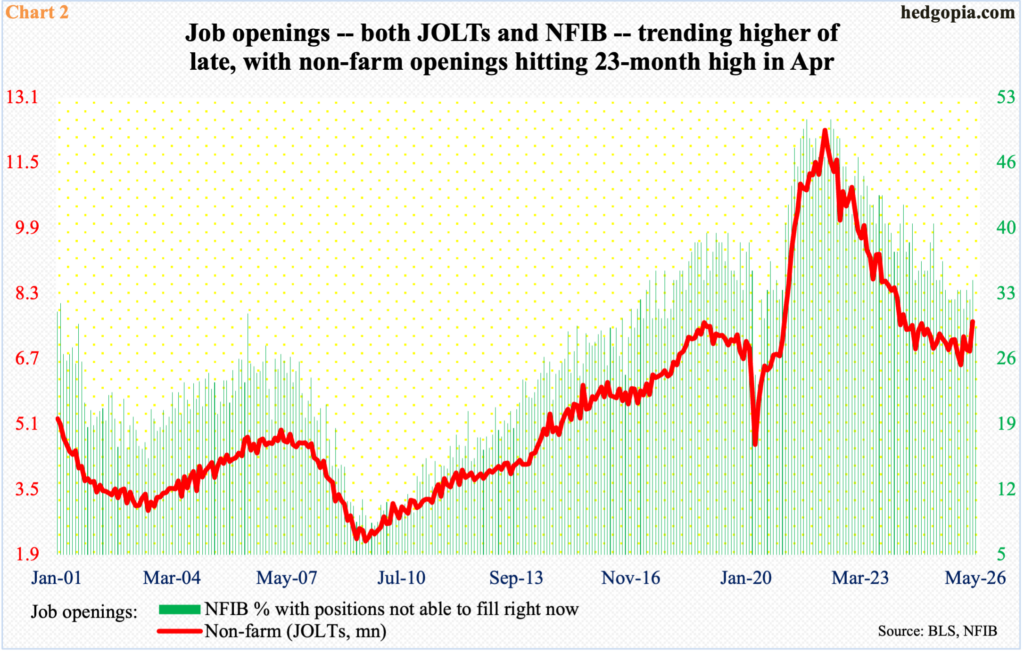
Concurrently, the jobs picture has improved from a very poor showing last year. In all of 2025, the economy created an average 10,000 non-farm jobs each month. In the first five months this year, the monthly average has jumped to 114,000. Job openings similarly seem to be turning a corner. Last December, non-farm openings hit a 63-month low of 6.55 million; in April this year, the metric stood at 7.62 million – a 23-month high. Openings hit an all-time high 12.3 million in March 2022.
That said, May’s openings – on schedule for Tuesday – will be watched closely, as small-business job openings meaningfully weakened in May, down five points month over month to 29, which set a six-year low. The two metrics do correlate well with each other (Chart 2).
Arguably, rate worries are beginning to take a toll on equities. Before the onset of the Iran war, markets were convinced that there would be at least two 25-basis-point cuts this year in the fed funds rate, which currently sits at a range of 350 basis points to 375 basis points. This dovish outlook has now been turned on its head, with futures traders putting their money on a hike by as early as the September meeting.
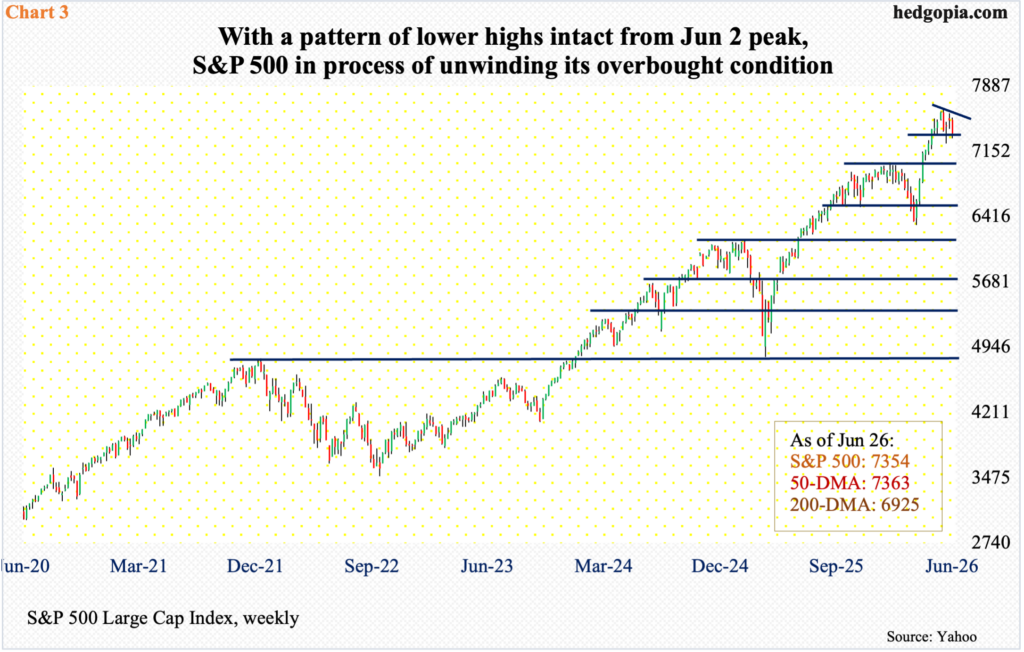
Through last week’s close, the S&P 500 has dropped 3.5 percent from its all-time high 7621 posted on the 2nd this month; the large cap index, as a matter of fact, was down 4.3 percent through last Friday’s intraday low 7294, but things improved a bit as bulls managed to push it up to close at 7354, still down two percent for the week. This precedes a 20.6-percent surge from the March 30 low of 6317, driving most indicators into gross overbought territory.
Last week, with a pattern of lower highs since the June 2 peak intact, the S&P 500 closed just below the 50-day (7363), and this was the second time in three weeks the average was being tested. Regardless of what happens in the sessions ahead, it is just a matter of time the 50-day will be breached decisively. On the weekly in particular, the index has a long ways to go before the overbought condition it is in gets unwound.
At some point, a crucial breakout retest does not occur until 7000, or just south of it (Chart 3).
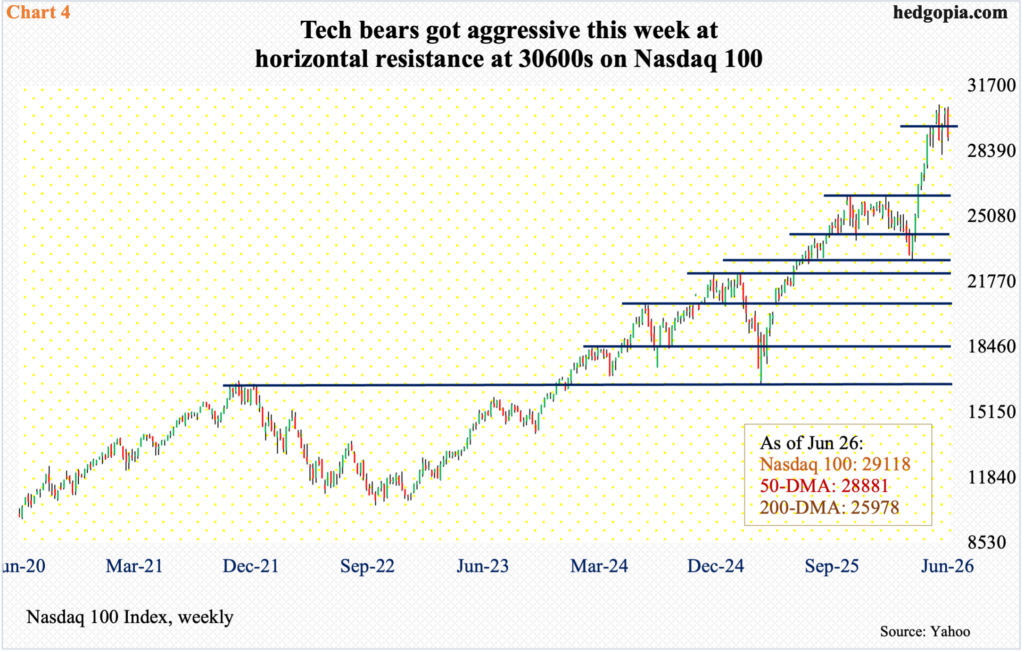
The Nasdaq 100 similarly is testing its own 50-day (28881), and like the S&P 500, this is the second time in three weeks the average is being tested. Last Friday, the tech-heavy index ticked 28891 before bids showed up to end the session at 29118; for the week, it gave back 4.2 percent. The index’s 5.3-percent decline from the June 3 peak of 30762 pales in comparison to the massive gains of 34.7 percent from March 30 when the index bottomed at 22841.
Given how overbought the Nasdaq 100 finds itself in on several weekly indicators, a major breakout retest at 26100s is a matter of when not if (Chart 4).
On Monday, tech bears got active as soon as the index hit horizontal resistance at 30600s; they will have built on this momentum once the 50-day gives way.
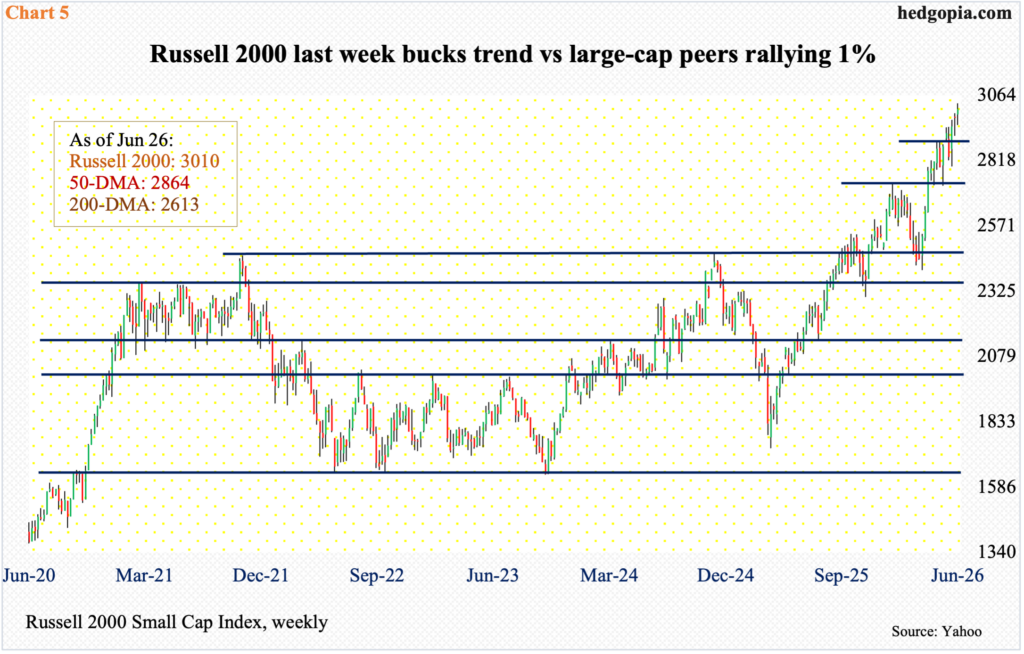
The situation is slightly different in the small-cap arena.
Three weeks ago, the Russell 2000 just about tested the 50-day (now 2864) – successfully. Unlike what is transpiring in large-caps, the average is not being tested currently. Far from it. Last week, the Russell 2000 added one percent to 3010, with a fresh intraday high of 3034 reached on Thursday. There is a lot of buffer small-cap bulls have built before the 50-day is even tested.
Before that happens, there is lateral support at 2940s, which was tested last Tuesday with a session low 2951. After this lies 2880s, which, too, stopped the bulls for a few weeks before a breakout occurred (Chart 5).
In the event of a drawdown, 2970s is worth watching.
Small-caps outperformed large-caps last week but will be hard to remain unscathed for too long if the latter continues to come under pressure.
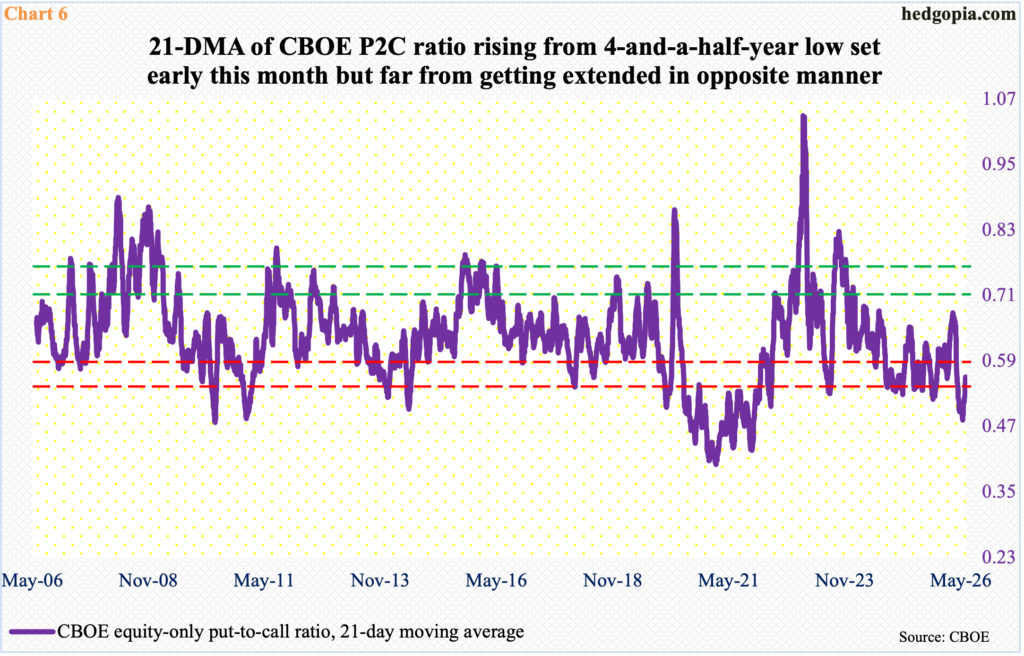
Options in this regard provide a good window into how elevated bullish sentiment was until not too long ago. On the 4th this month, the 21-day moving average of the CBOE equity-only put-to-call ratio came in at 0.482, which was the lowest in four and a half years (Chart 6). The ratio is rising, registering 0.560 as of last Friday, but has plenty of room to continue higher to unwind the extended condition it is in. At some point, elevated optimism will give way to elevated pessimism. It has always been that day; this time should be no different. If past is prologue, a rising ratio gets reflected in falling equity indices.
Comments
Log in or sign up to join the conversation.