
For now, we know as of 2019Q4, we’re not in a recession, according to Jim’s analysis. But Q4/Q4 GDP growth fails to hit Trump targets (again!), business cycle indicators continue to plug along, but RV sales plunge 16% y/y. And yield curve inverts (again)! Is it flight to safety or lower expected future short rates?

Figure 1: Q4/Q4 GDP growth (blue bar), Troika forecast from Mid-Session Review FY2019 (orange line), and Trump-Pence campaign promise (red dashed line).
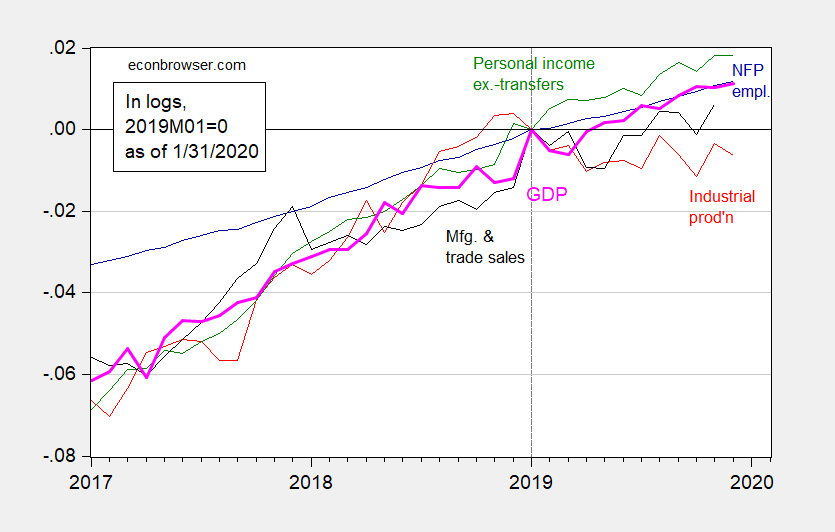
Figure 2: Nonfarm payroll employment (blue), industrial production (red), personal income excluding transfers in Ch.2012$ (green), manufacturing and trade sales in Ch.2012$ (black), and monthly GDP in Ch.2012$ (pink), all log normalized to 2019M01=0.Source: BLS, Federal Reserve, BEA, via FRED, Macroeconomic Advisers (1/29 release), and author’s calculations.
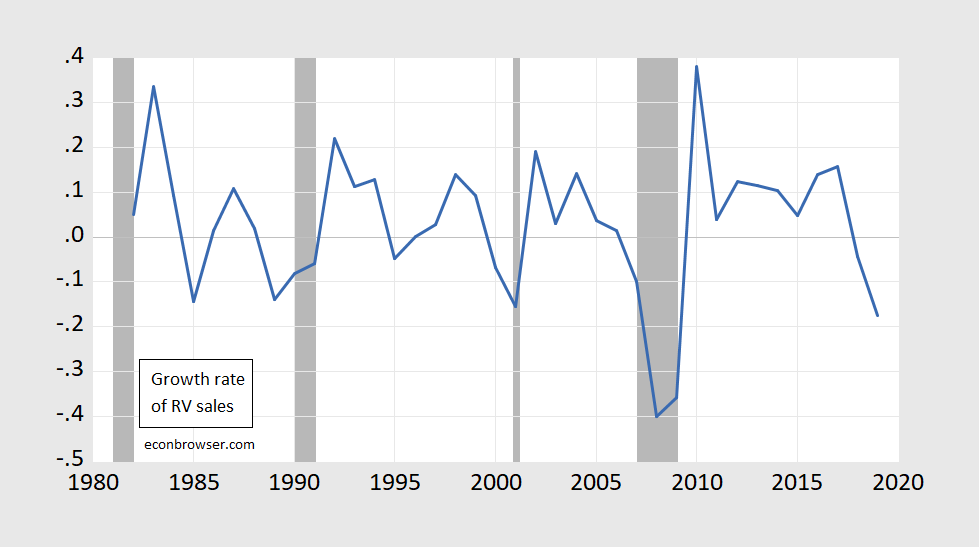
Figure 3: Y/Y growth rate of sales of recreational vehicles (blue), NBER defined recession dates (gray). Source: rvia.org and author’s calculations.
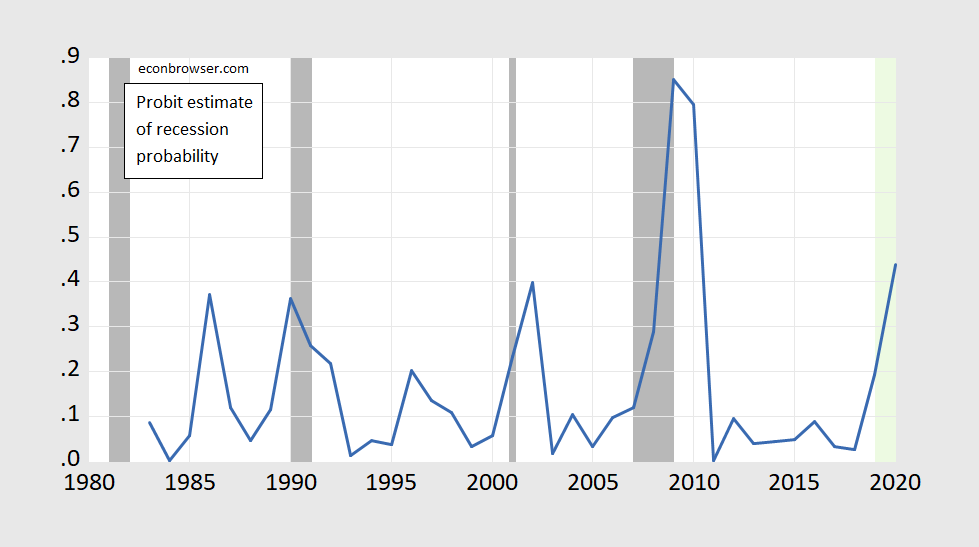
Figure 4: Predicted recession probabilities from simple probit of recession on one lag of sales growth rate (blue). NBER defined recession dates shaded gray. Light green denotes forecast.
Notice that this probabiity assessment is not subject to the changing behavior of the term premium over time.
That being said, there has been action on the yield curve front over the month of January.
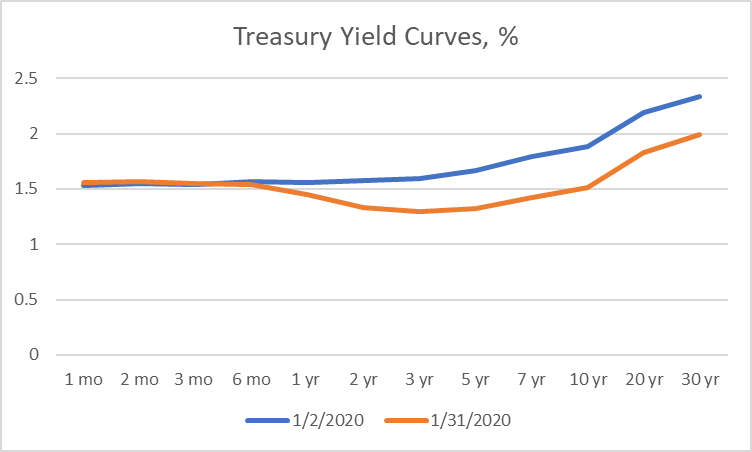
Figure 5: Yield curve on 1/2/2020 (blue) and on 1/31/2020 (orange). Source: Treasury.
By the end of January, the yield curve is inverted (relative to 2 months) all the way out to somewhere between 10 and 20 years. Placing in the context of a longer time period:
(Click on image to enlarge)
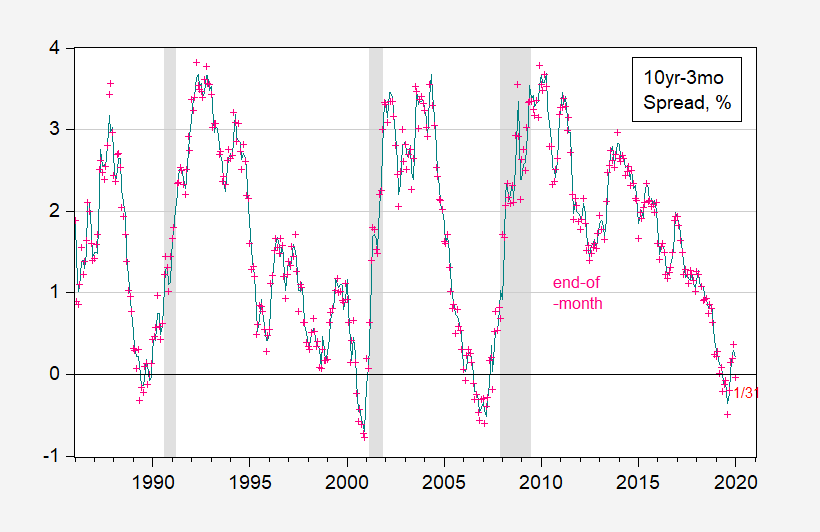
Figure 6: 10 year-3 month constant maturity Treasury spread, monthly average (blue), end of month (pink +). NBER recession dates shaded gray. Source: Fed via FRED, Treasury, and author’s calculations.
The average values of the term spread suggest a slight upward move in the probability of recession in 12 months, once again using a plain vanilla probit.
(Click on image to enlarge)
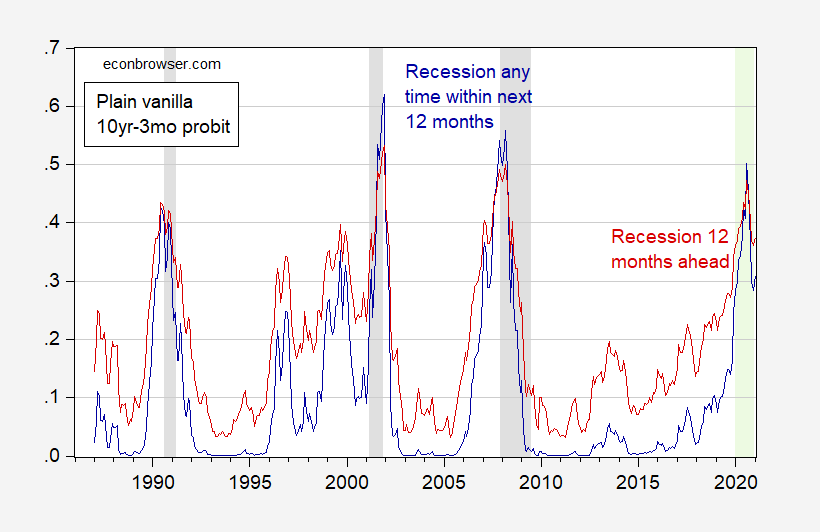
Figure 7: Probability of recession in 12 months (blue), and within 12 months (red) using probit based on 12 month lagged 10yr-3mo term spread. NBER defined recession dates shaded gray. Light green shading denote forecasted values. Source: author’s calculations.
Last bit of information: Not only is the 10yr-3mo spread negative, so too is the TIPS 10 year (real) yield.
(Click on image to enlarge)
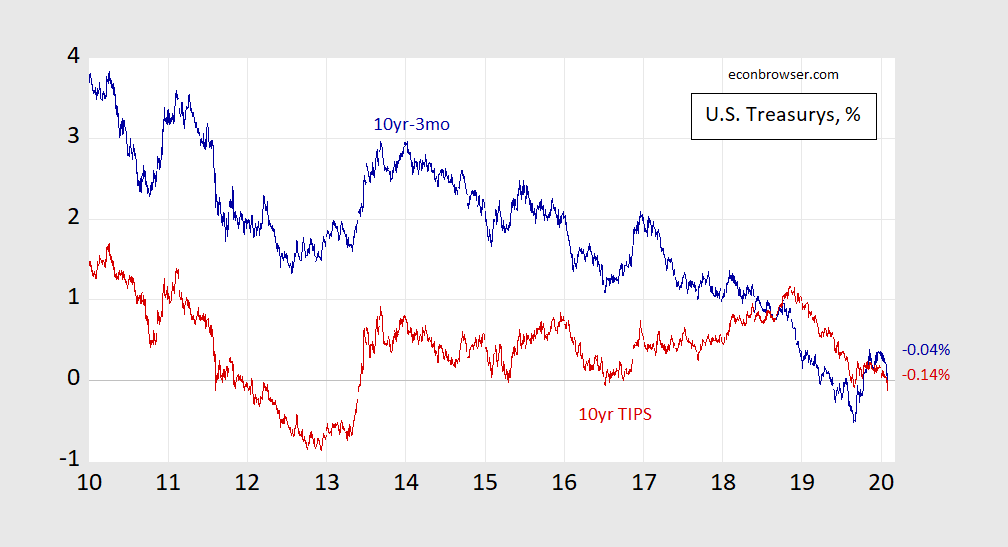
Figure 8: 10 year-3 month Treasury term spread (blue), and 10 year TIPS yield (red). Source: Fed via FRED, Treasury, author’s calculations.


Comments
Log in or sign up to join the conversation.