

The Bureau of Economic Analysis announced today that U.S. real GDP grew at a 2.1% annual rate in the second quarter of 2019. That’s pretty near the 2.2% average rate since the recovery from the Great Recession began in 2009:Q3.
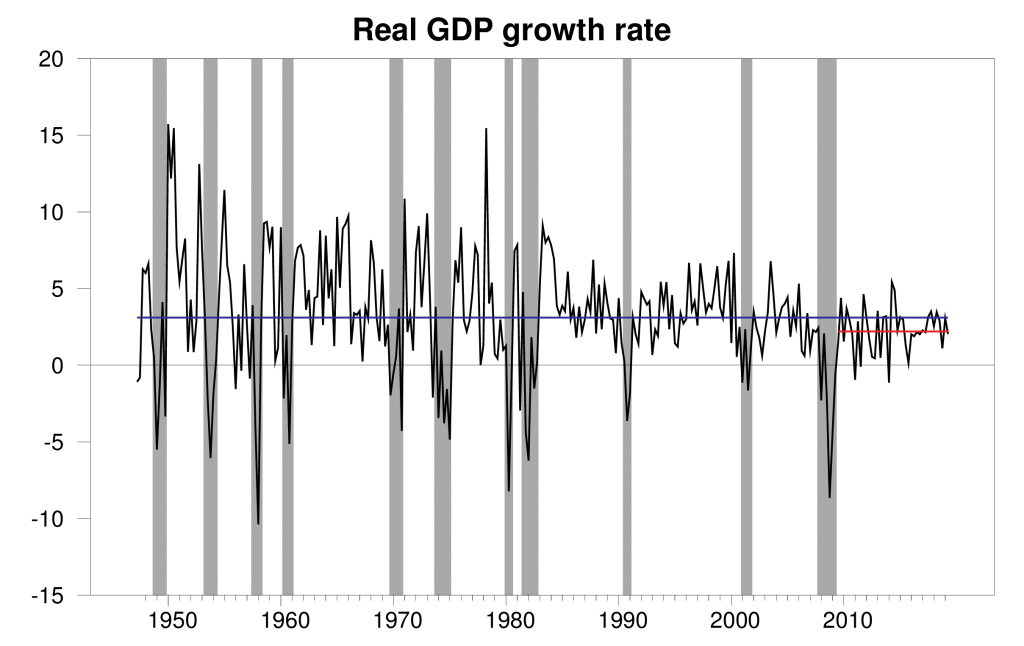
Real GDP growth at an annual rate, 1947:Q2-2019:Q2, with the 1947-2019 historical average (3.1%) in blue and post-Great-Recession average (2.2%) in red.
That brought the Econbrowser Recession Indicator Index to 2.9%, consistent with the favorable low levels we’ve seen over the last two years. The U.S. economic expansion has now been under way for 10 years (2009:Q3-2019:Q2), matching the previous record for the longest expansion on record (1991:Q2-2001:Q1).
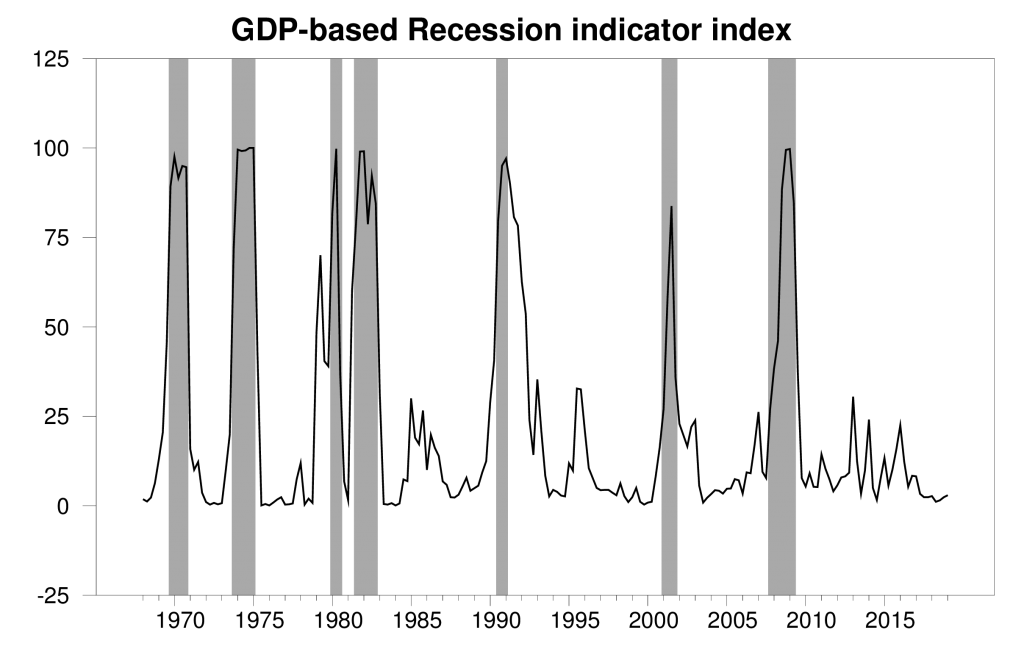
GDP-based recession indicator index. The plotted value for each date is based solely on information as it would have been publicly available and reported as of one quarter after the indicated date, with 2019:Q1 the last date shown on the graph. Shaded regions represent the NBER’s dates for recessions, which dates were not used in any way in constructing the index, and which were sometimes not reported until two years after the date.
President Trump assessed these numbers with this tweet:
Q2 GDP Up 2.1% Not bad considering we have the very heavy weight of the Federal Reserve anchor wrapped around our neck. Almost no inflation. USA is set to Zoom!
It is true that housing (in the form of anemic residential fixed investment) has been holding GDP growth back for several years.
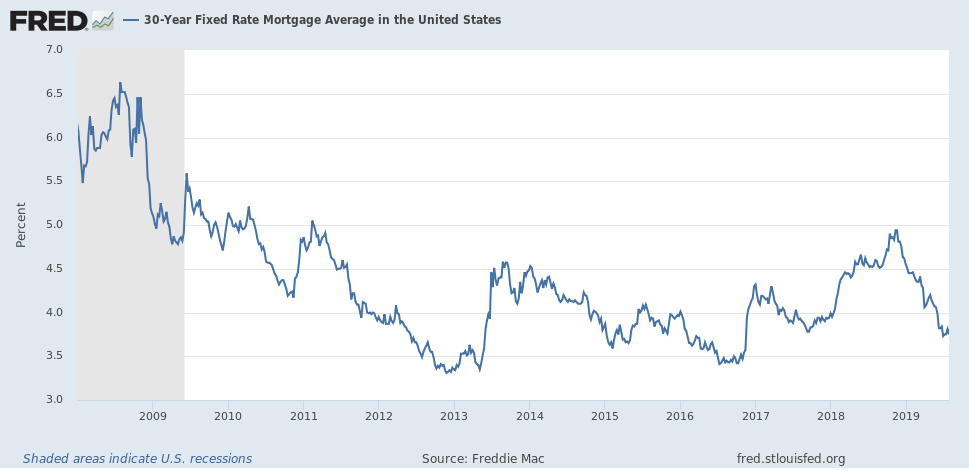
And rising interest rates during 2018 may have been one factor in that housing slowdown. But rates have come down significantly this year, and are now back essentially to the level before the run-up began.
It takes some time for lower interest rates to show up in new home sales. Some of my earlier research concluded that the biggest effects aren’t observed until 4 months after interest rates change.

Percent change in new home sales the indicated number of weeks after a 10-basis-point increase in the 30-year fixed mortgage rate. Source: Hamilton (2008).
If that was the whole story, I would have expected to see some rebound by now. And new building permits don’t give an encouraging sign looking ahead.
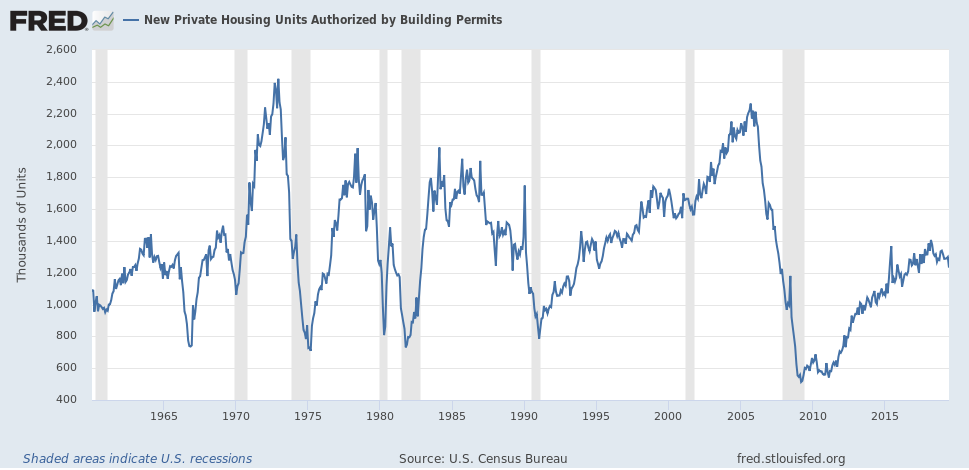
So I don’t think it’s fair to give the Fed all the blame for the current stagnation of residential fixed investment. Another hypothesis to consider is the role of increases in the after-tax cost of owning a home that resulted from the changes in tax laws implemented in December of 2017.
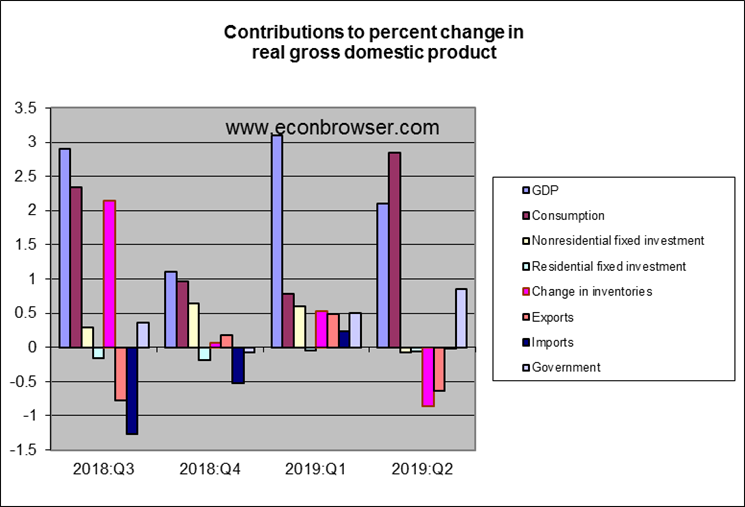
Returning to the chart above of contributions to GDP growth, a fall in exports subtracted 0.6% from the annual GDP growth rate.
Two-thirds of that drop came from civilian aircraft, engines and parts (see BEA Table 4.2.2), reflecting Boeing’s self-inflected wounds. The hit to GDP from those may get worse, and also contributed to the Q2 drop in nonresidential fixed investment, a category that had contributed 0.6% to the Q1 GDP growth. Also likely contributing to the Q2 decline in exports was tensions over world trade, another development high on many analysts’ list of factors to worry about in the current economic environment.
I agree with the President on this much– the numbers could have been better.
Comments
Log in or sign up to join the conversation.