

The Bureau of Economic Analysis announced today that U.S. real GDP grew at a 0.2% annual rate in the first quarter. And that was even after a big inventory build-up from goods produced but not sold. Taking out the inventory contribution, real final sales fell by half a percent at an annual rate.
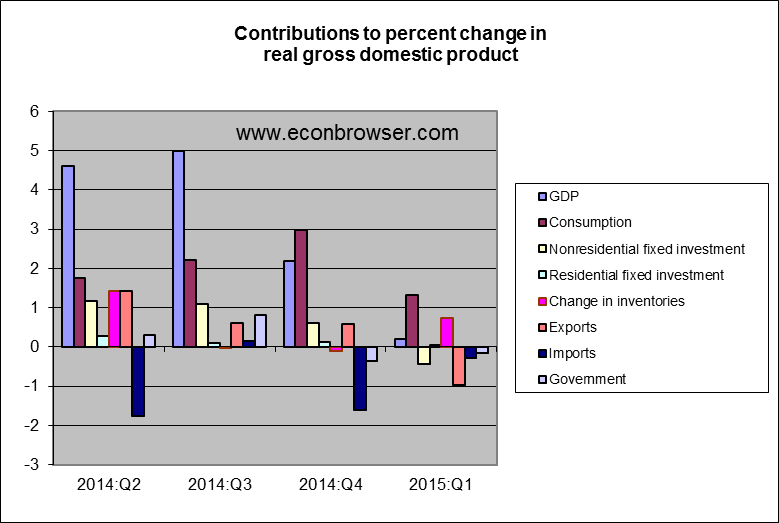
The biggest factor was a deterioration in net exports, with lower exports subtracting nearly 1 percentage point from the annual growth rate and rising imports subtracting another quarter point. The strengthening dollar, which ended the quarter 8% higher than it had started and 20% higher than it had been a year earlier surely contributed to this. To the extent the strong dollar reflects the fact that the U.S. is likely to tighten monetary policy sooner than some of its trading partners, this underscores the need for the Federal Reserve to take international developments into account. The good news is that the dollar has slipped back down 2% from where it had been at the end of March. Labor problems on west coast portsduring the quarter may also have had some temporary effect on exports. But to the extent that the fall in exports reflects economic weakness outside the U.S., it is more of a source of concern.
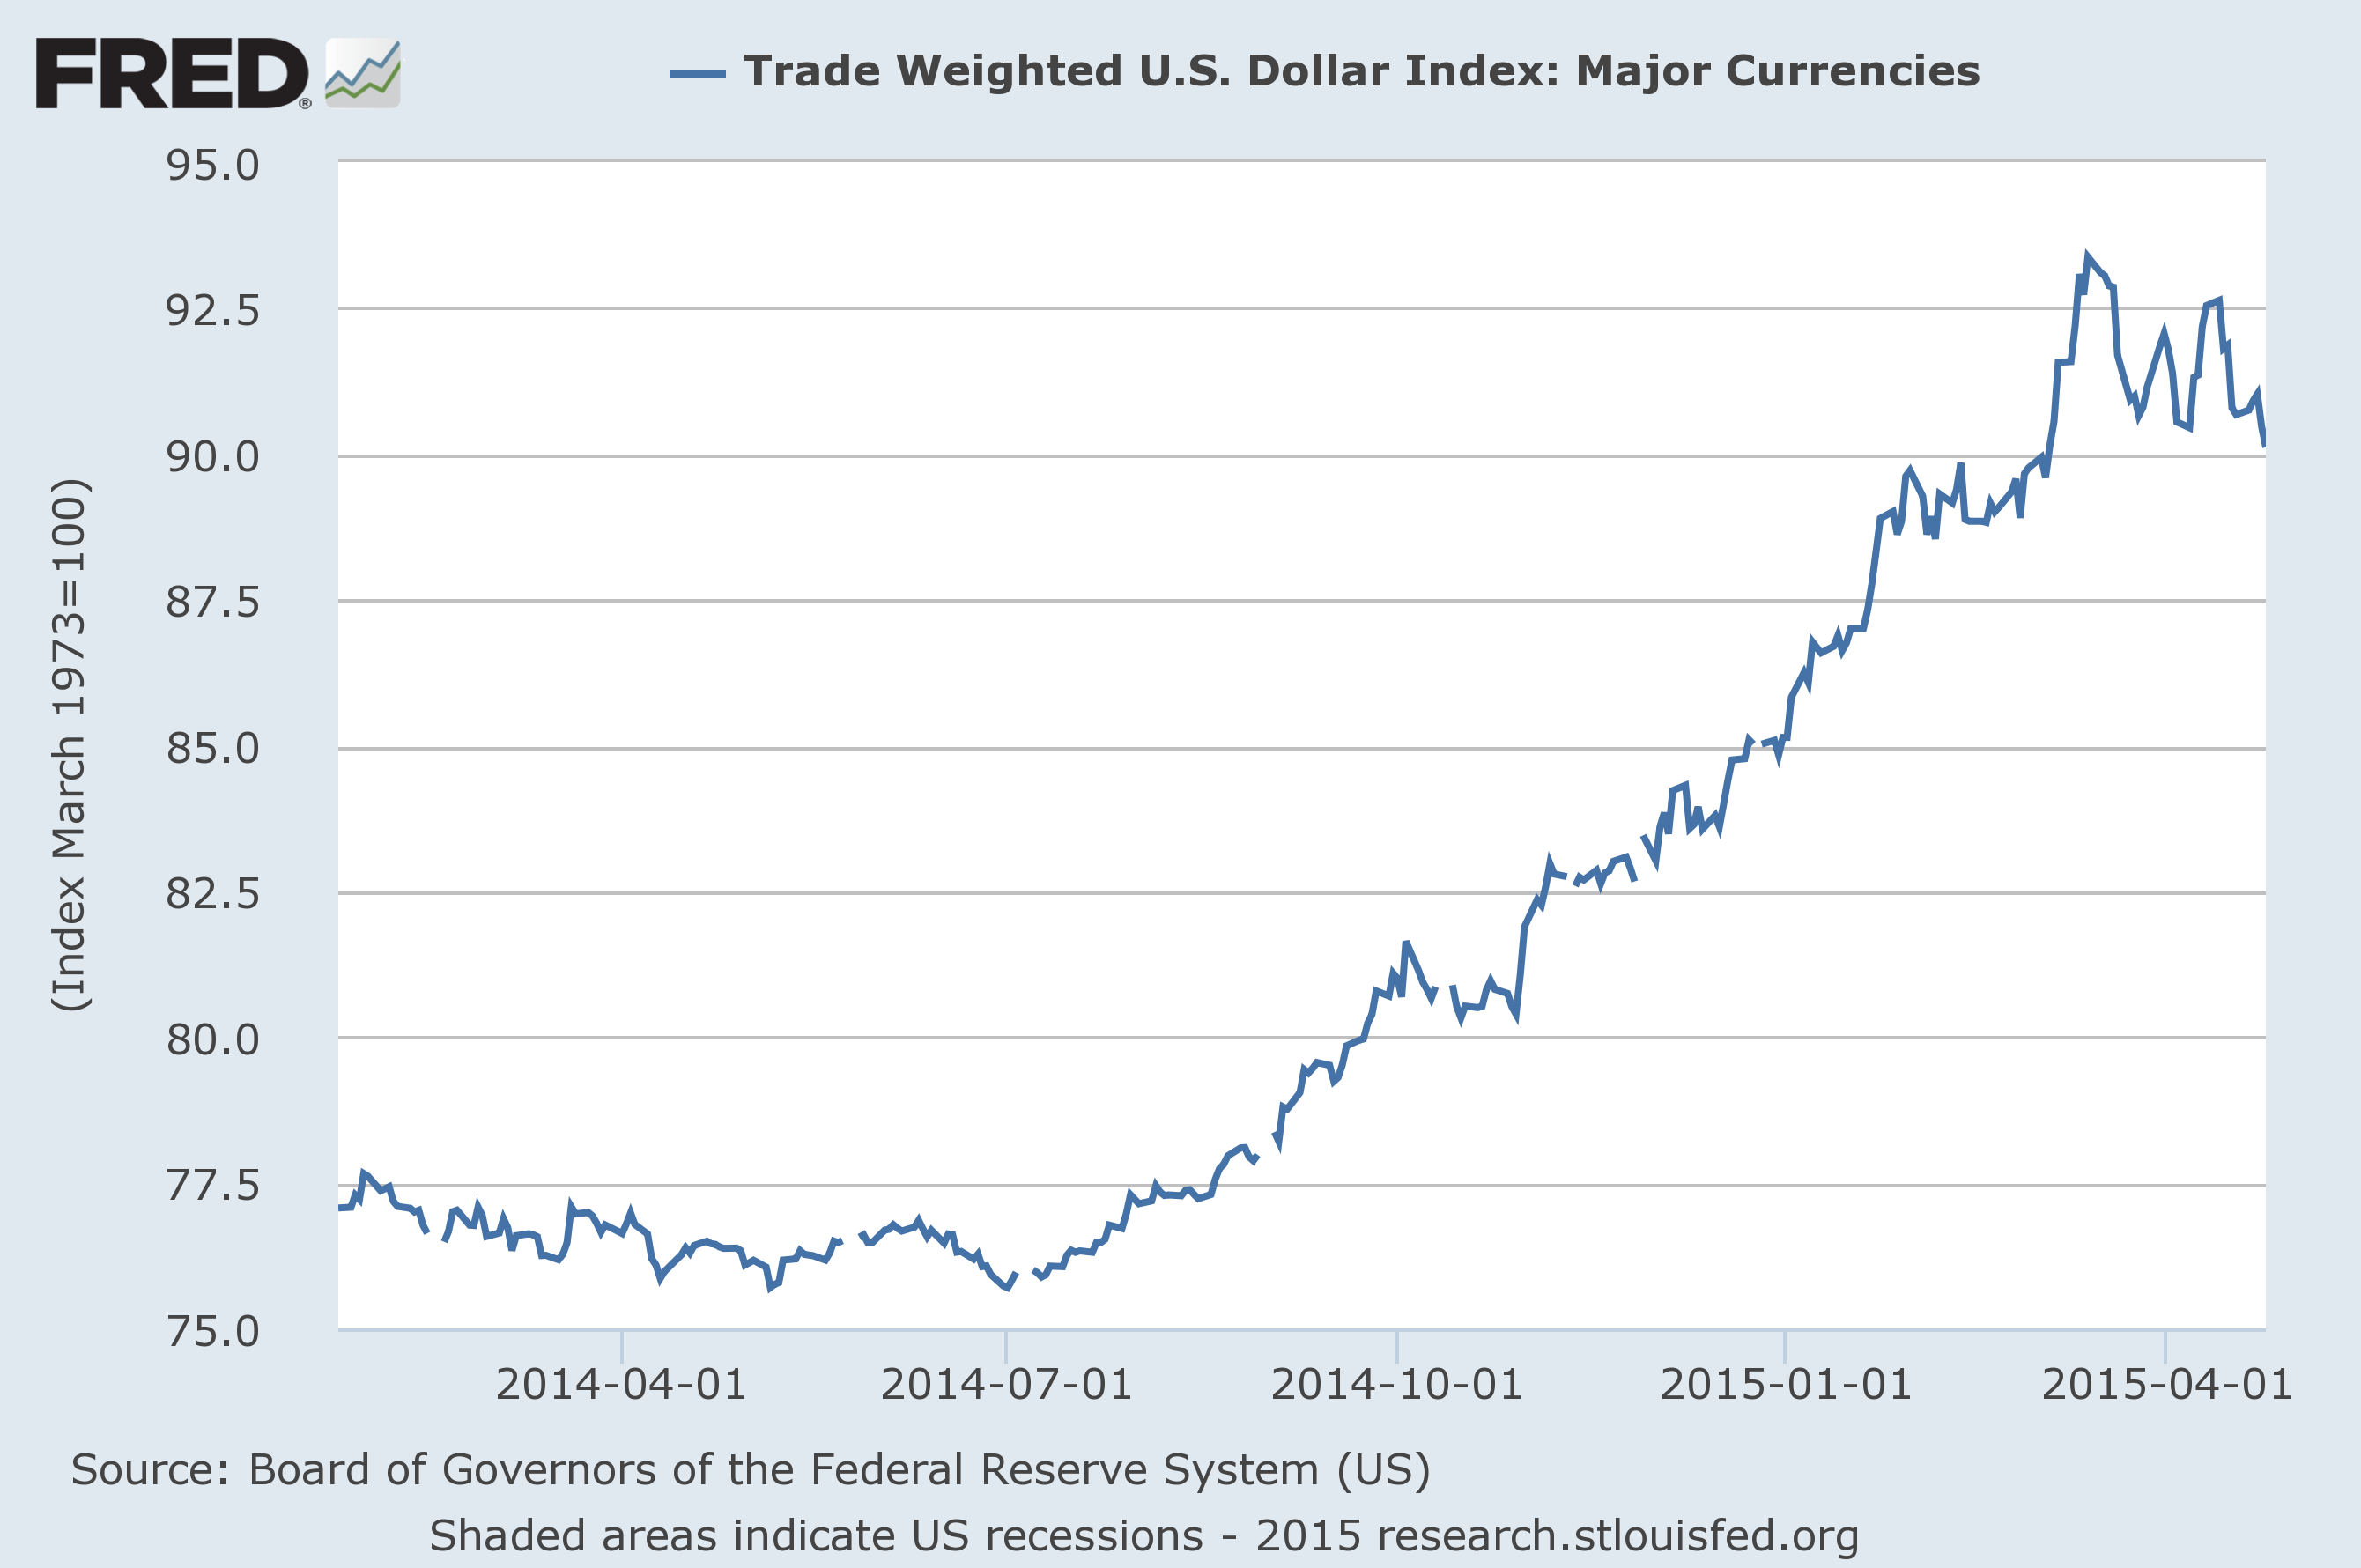
Source: FRED.
The GDP numbers also reflected weakness within the U.S., with nonresidential fixed investment subtracting 0.44 percentage points from the annual growth rate. Bill McBride thinks this “was probably due to bad weather and less investment in oil and gas.” Shale oil has changed industry dynamics in that firms get can get in and out of these operations much more quickly than most conventional oil projects. The result is that the lag between an oil price change and a response in investment spending is shorter than it used to be. I was expecting this to be more than offset by higher consumption spending as consumers spent the cash they saved at the gas pump. But consumption growth in the first quarter was also weaker than it has been.
The new GDP report brought a modest increase in our Econbrowser Recession Indicator Index up to a still quite low value of 7.9%. This uses today’s data release to form a picture of where the economy stood as of the end of 2014:Q4, and views the Q1 report as most likely a temporary disappointing blip.
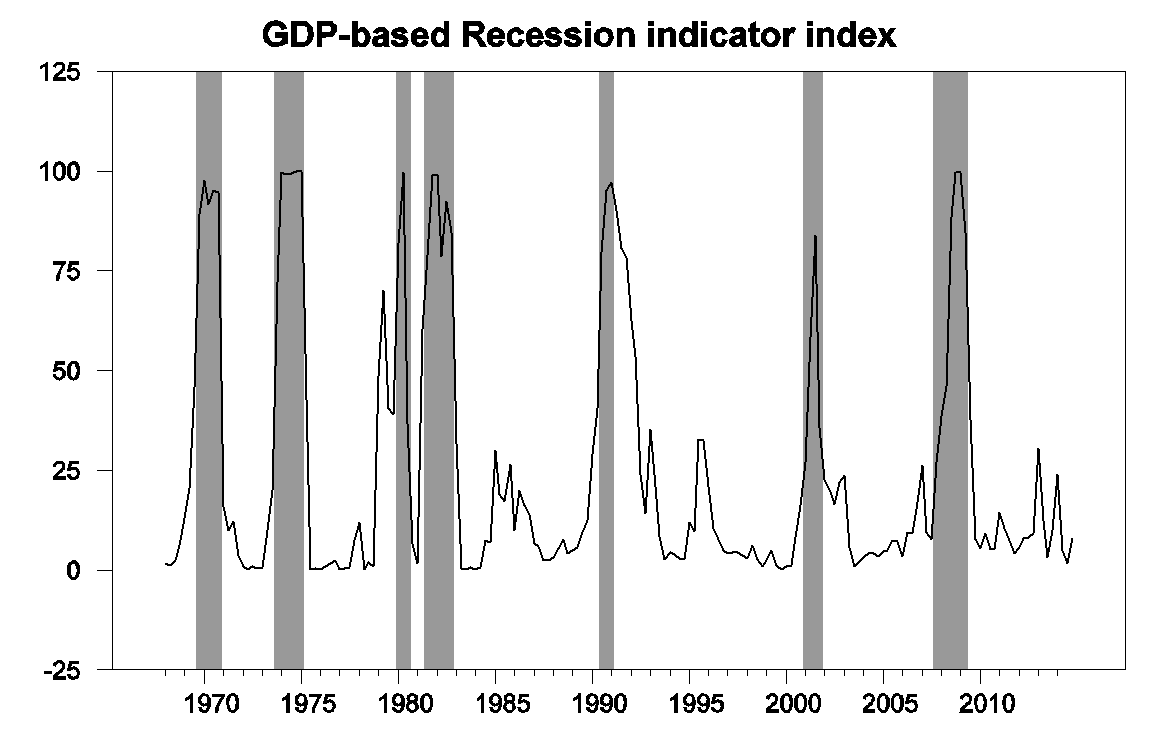
GDP-based recession indicator index. The plotted value for each date is based solely on information as it would have been publicly available and reported as of one quarter after the indicated date, with 2014:Q4 the last date shown on the graph. Shaded regions represent the NBER’s dates for recessions, which dates were not used in any way in constructing the index, and which were sometimes not reported until two years after the date.
Despite the latest numbers, U.S. real GDP in 2015:Q1 stood 3% above its value from a year earlier. The bigger picture is that U.S. economic growth continues despite temporary setbacks and some more significant headwinds.
Comments
Log in or sign up to join the conversation.