

Reuters – “U.S. consumer prices post largest gain in 13 years; inflation has likely peaked”. Surprises on the upside, put in context. Stripping out volatile components, inflation is up; focusing on sticky prices, inflation is down.
The CPI surprise was 0.4%, while that for Core CPI was 0.43% (relative to Bloomberg consensus as of yesterday). To place these in context, the variability of m/m changes in the (log) CPI and Core CPI is about 0.2%.
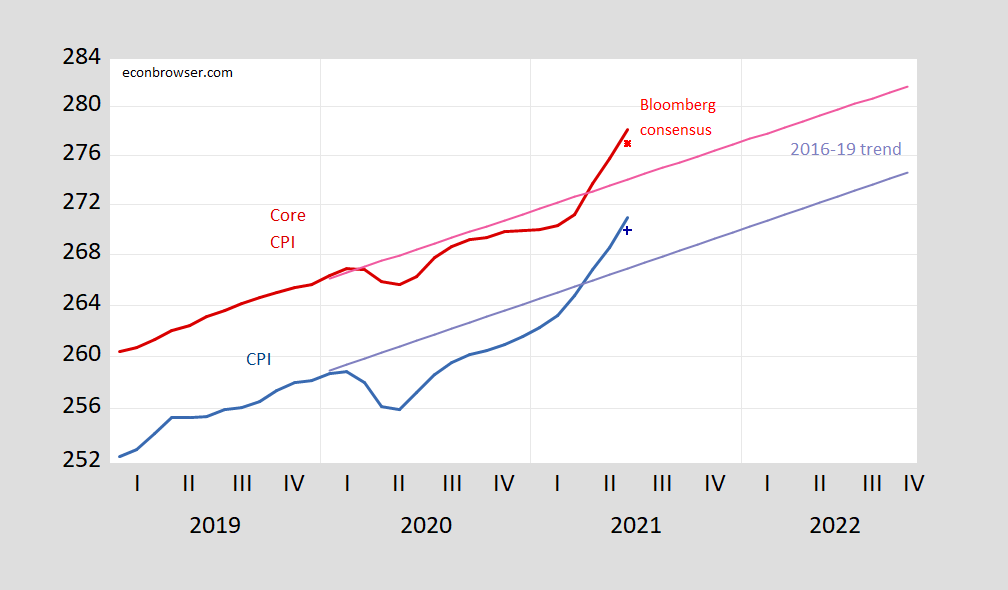
Figure 1: CPI all urban (bold blue line), Bloomberg consensus (blue +), 2016-19 stochastic trend (blue gray line), CPI less food and energy (“core”), (bold dark red), Bloomberg consensus (red square), and 2016-19 stochastic trend (red gray line), both on log scale. Source: BLS, Bloomberg, and author’s calculations.
In addition, the price level as of June was above the 2016-19 linear trend, as shown above. Prices have caught up, and more (both are about 1.5% above trend).
On the other hand, while headline m/m inflation is up, a measure that focuses on infrequently changed prices — the sticky price CPI — has declined, suggesting easing pressures. The trimmed CPI — which excises highly volatile components — kept on rising indicating it’s not outliers driving June increases.
(Click on image to enlarge)
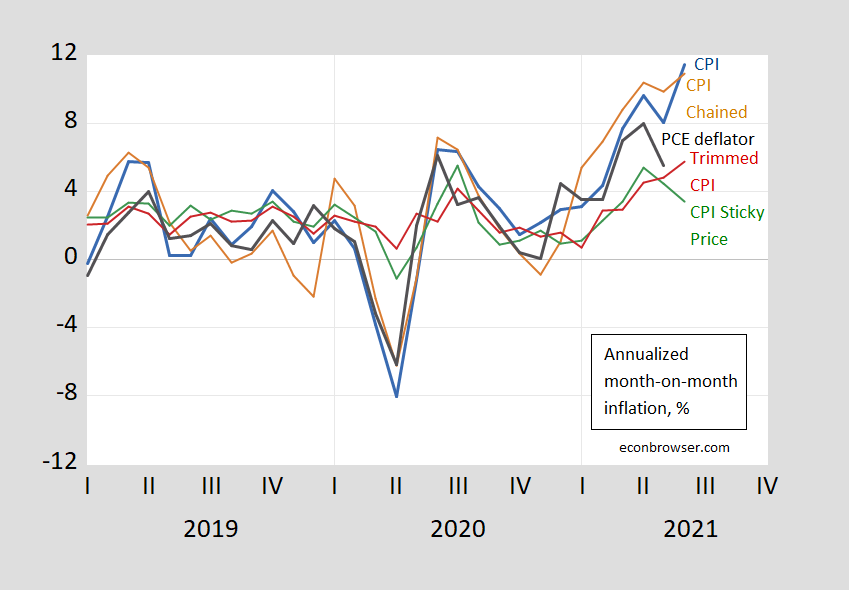
Figure 2: Month-on-month annualized inflation from CPI-all urban (blue), from personal consumption expenditure (PCE) deflator (black), chained CPI, nsa (brown), sticky price CPI (green), and 16% trimmed mean CPI (red). Source: BLS, Atlanta Fed, Cleveland Fed, via FRED, and author’s calculations.
What about core measures? These are shown in Figure 3 (no trimmed core shown).
(Click on image to enlarge)
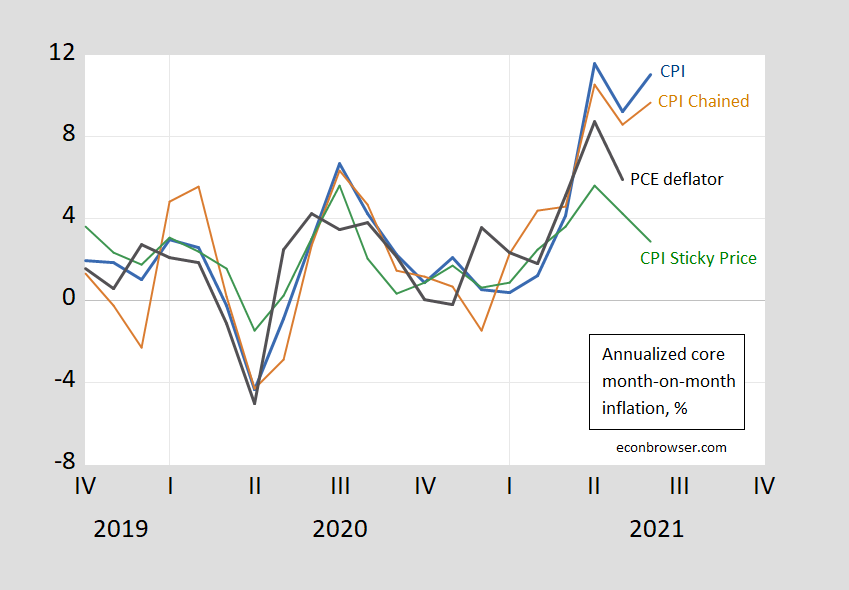
Figure 3: Month-on-month annualized inflation from CPI-all urban (blue), from personal consumption expenditure (PCE) deflator (black), chained CPI, nsa (brown), and sticky price CPI (green). Source: BLS, Atlanta Fed, Cleveland Fed, via FRED, and author’s calculations.
The pandemic has made it more important to examine the role of specific components. CEA notes that excluding “cars and pandemic-affected services, core inflation rose 0.22 percent month-over-month, relative to 0.28 percent in May and 0.31 percent in April”. This is shown in this graph:
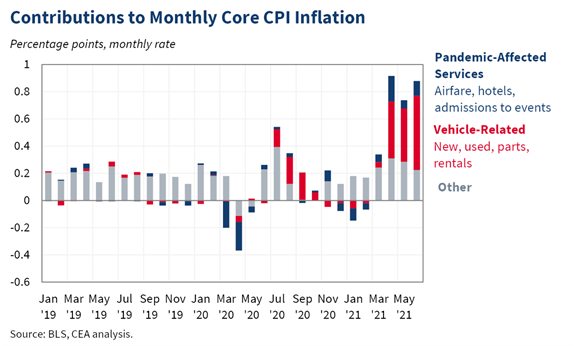
Source: CEA (7/13/2021).


Comments
Log in or sign up to join the conversation.