

Weekly Chart
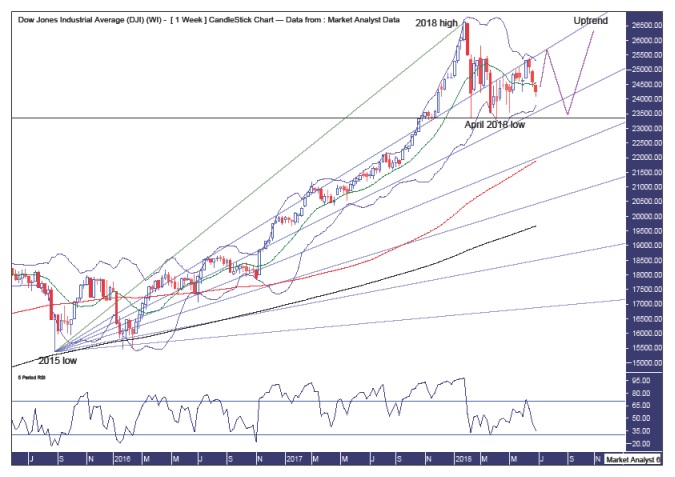
Pattern – an uptrend is clearly in force and the action since the January 2018 looks corrective in nature. I believe this corrective phase still has more time to play out. Price made a low yesterday at 24084 and while we may see that level tested I favor it to hold for the time being.
Bollinger Bands – price is now back at the middle band I favor support to come in here and send it back to the upper channel for one final downside test which sees price hit the lower band. A move straight down to the lower band is certainly not out of the question and if that were to occur then it probably means the next leg higher will commence earlier than expected.
Fibonacci – price recently found resistance at the 23.6% angle and I favor price to have another crack at that resistance before being rejected once again. If that is to occur then I will be looking for a solid test of support from the 38.2% angle before price begins a new upleg.
Horizontal line – denotes the April 2018 of 23344 and price breaking this level, or at least closing below it, will likely mean I am wrong about the next leg commencing. I do favor price to give this level a good test however with price turning back up above it, thereby creating a higher low.
Moving averages – in a very bullish position.
RSI – currently weak given the recent move down.
Monthly Chart
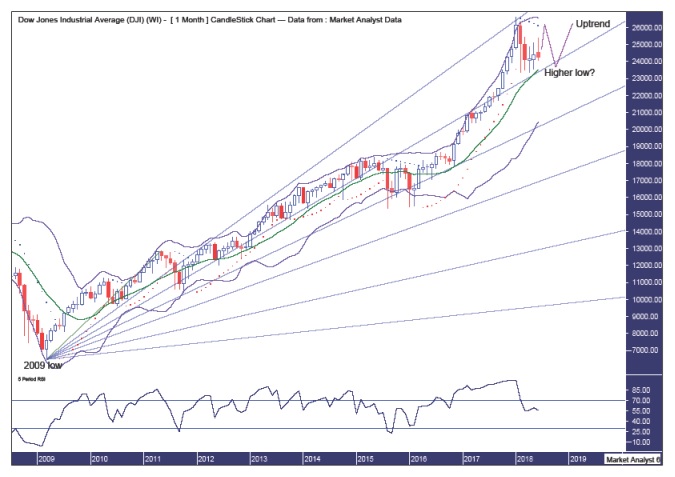
Pattern – a big bull trend is at hand, obviously.
Bollinger Bands – the price has been finding support at the middle band, just above it in fact, and I believe a more solid test of this band will be seen before the major uptrend continues. I suspect this test will come later in the year.
PSAR – the dots are currently above price indicating a bearish stance. I favor price to take out these dots, which currently stand at 26125, before reversing back down and giving the dots on the downside a test.
Fibonacci – the 23.6% angle has provided support and I believe the price will eventually give this angle another test which may see price dip marginally under it.
RSI – just in a strong territory and we may see it dip into weak territory before the next upleg commences.
Logarithmic Yearly Chart
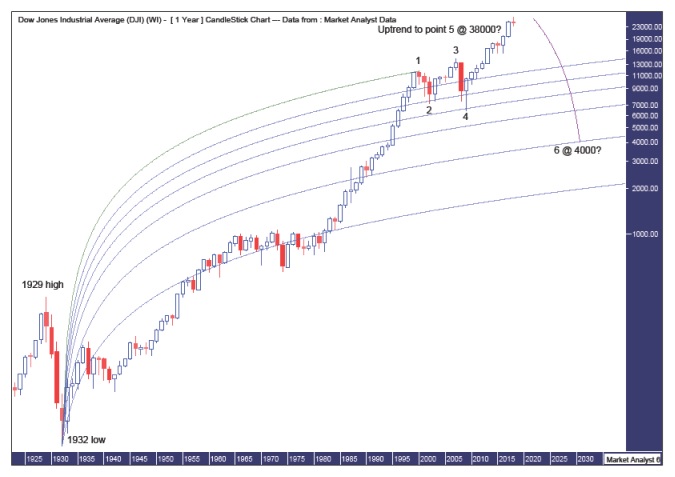
Pattern – price looks to be forming a 5 point broadening top with points 1 to 4 already in place with price now on its way up into an eventual point 5 high. Perhaps that will turn into a 7 point broadening top with the subsequent bear market low a point 6 low.
Fibonacci - the question is how high will this bull trend trade? Given price is in blue sky territory I can only guess by taking an estimate of the subsequent bear market low using a Fibonacci Fan from the 1932 low to point 1 high set in 2000. I am looking for the bear market low to get back down to around the 76.4% angle which looks to be around the 4000 level. The 88.6% angle is around 2000 and that just seems too preposterous (as if the 4000 level doesn’t appear too!). After this bull market top is in, which I believe is still several years away, I think we will see a bear market similar to that which occurred after the 1929 top. In that case, price dropped around 90% into the 1932 low. If we are to see another 90% drop and assume the low will be around the 4000 level then that implies the final bull market high would be around the 38000 level.
Summing up, I believe price will continue its corrective phase over the coming months before launching higher as the massive overall bull market continues on its merry way.


Comments
Log in or sign up to join the conversation.