
Gold can thank a weaker dollar for its most recent jump, but have the yellow metal’s fundamentals changed or is it simply counter trending?
Do you remember the Beatles’ song With A Little Help from My Friends? Well, gold is getting a slight boost from its friend, the U.S. dollar. Ok, it’s a love and hate relationship, and gold is singing out of tune, as the fundamentals and overall outlook have not changed. Gold should be thinking “what will happen when the USD stands up and walks out on me?”
Gold moved higher yesterday (Feb. 8), and so did silver and miners. At the same time, the USD Index moved lower. Did the above change anything in the outlook? Let’s check.
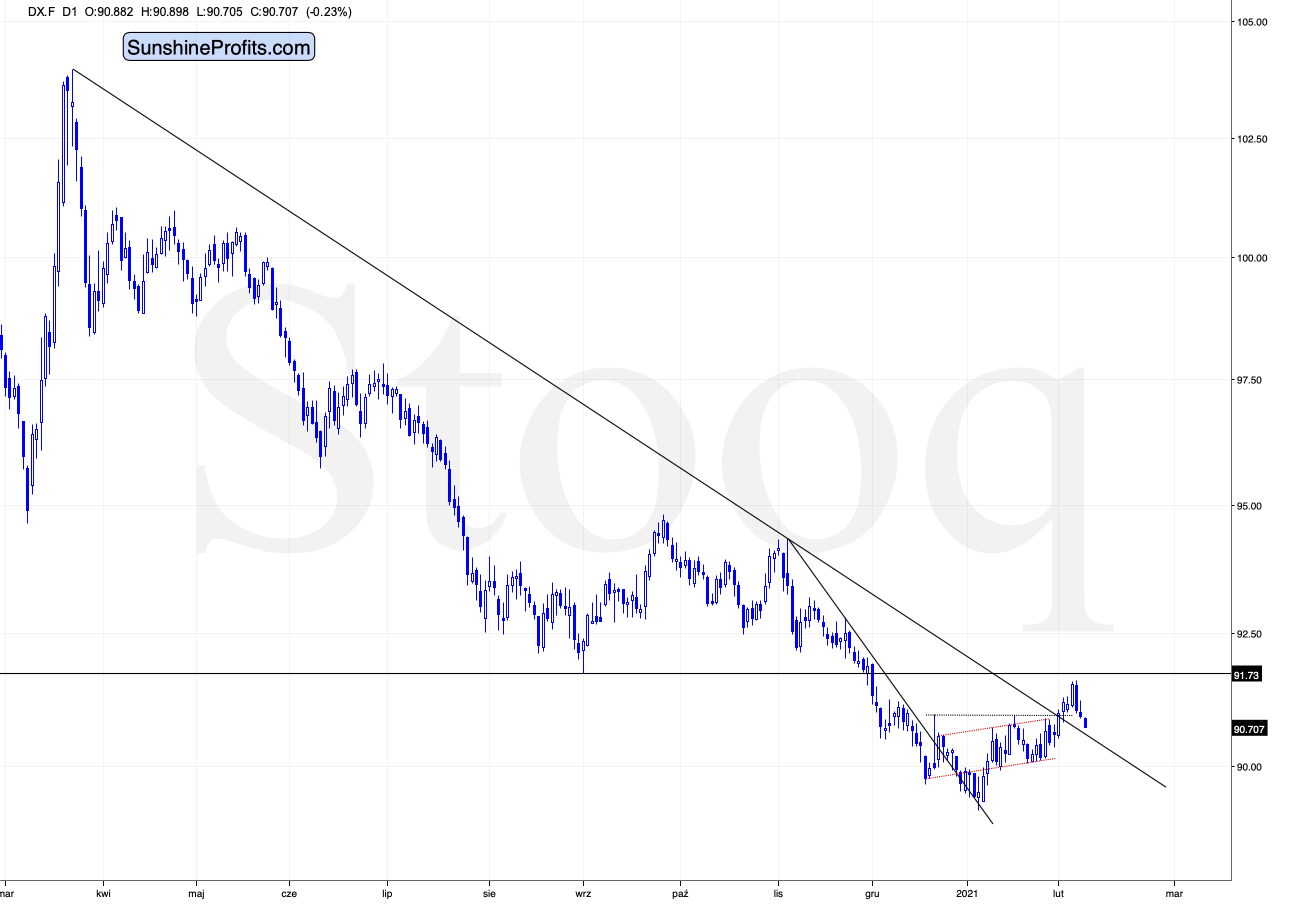
Figure 1 - USD Index
In yesterday’s analysis, I commented on the USD Index’s performance in the following way:
Again, because assets don’t move in a straight line, it’s plausible that the USD Index retests its declining resistance line, while gold retests its rising support line. If this occurs, the USDX is likely to decline to the 90.6 range, while gold will receive a short-term boost. Remember though: the outcome does not change their medium-term trends and the above confirmations signal that the USDX is heading north and gold is heading south.
The part that I put in bold is exactly what is being realized right now. The USDX is correcting after the breakout, likely verifying the previous resistance as support.
Unless the USDX breaks back below the declining medium-term support line in a meaningful way, the bullish implications for the following weeks will remain intact.
So, nothing really changed from this perspective. The USD Index could actually move a bit lower and the overall outlook would not change.
But gold rallied – didn’t it change anything?
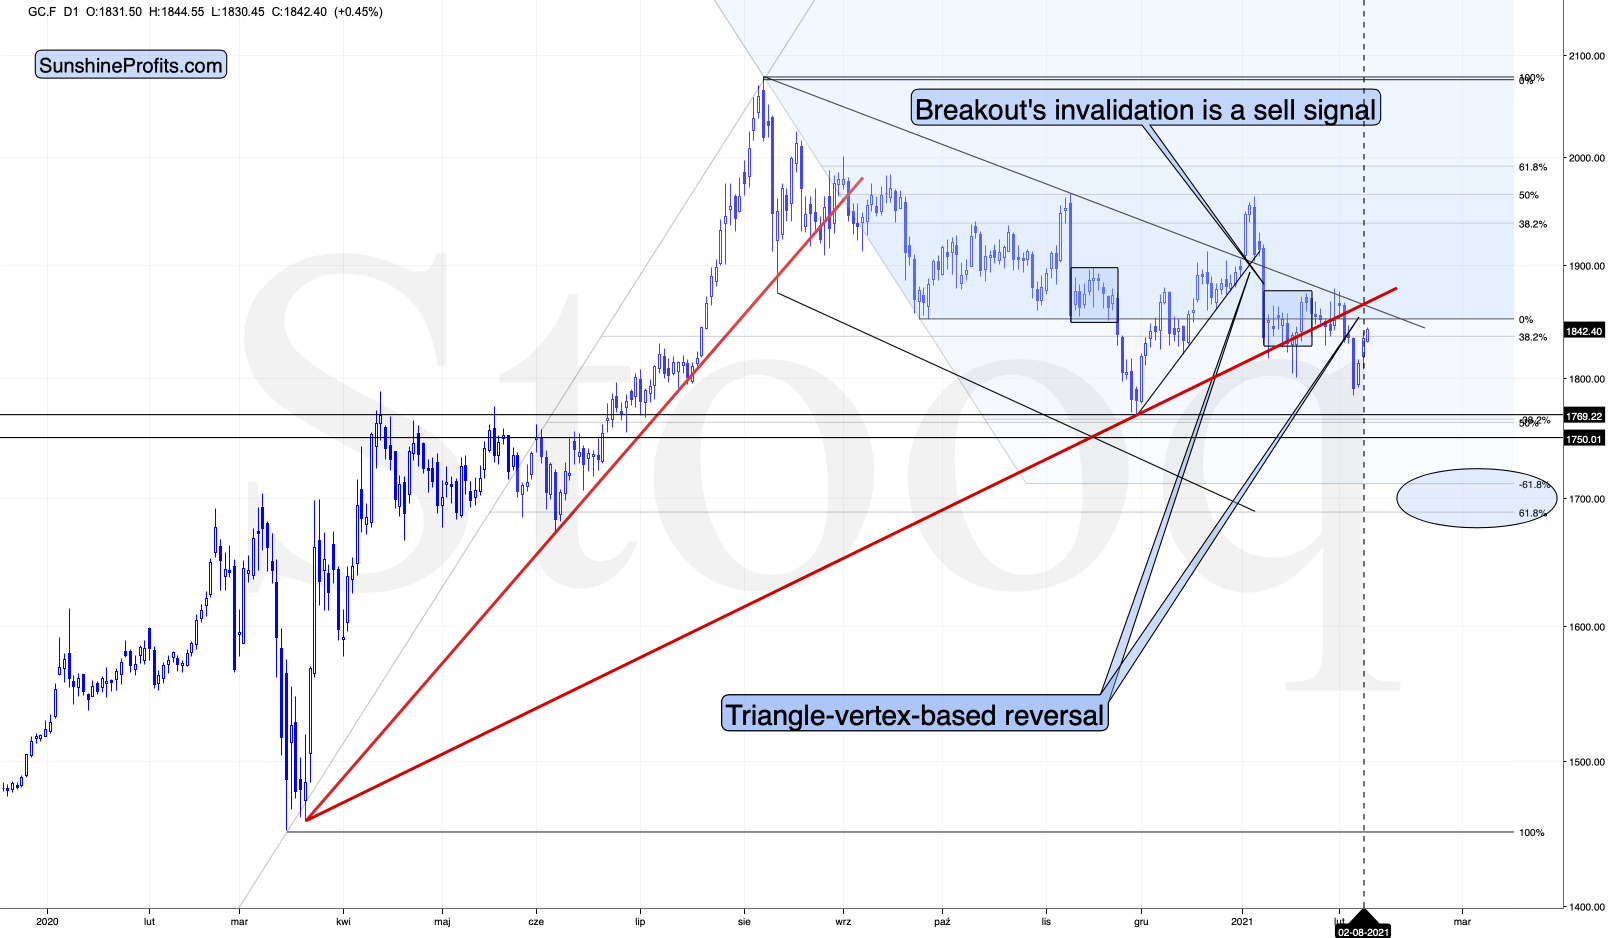
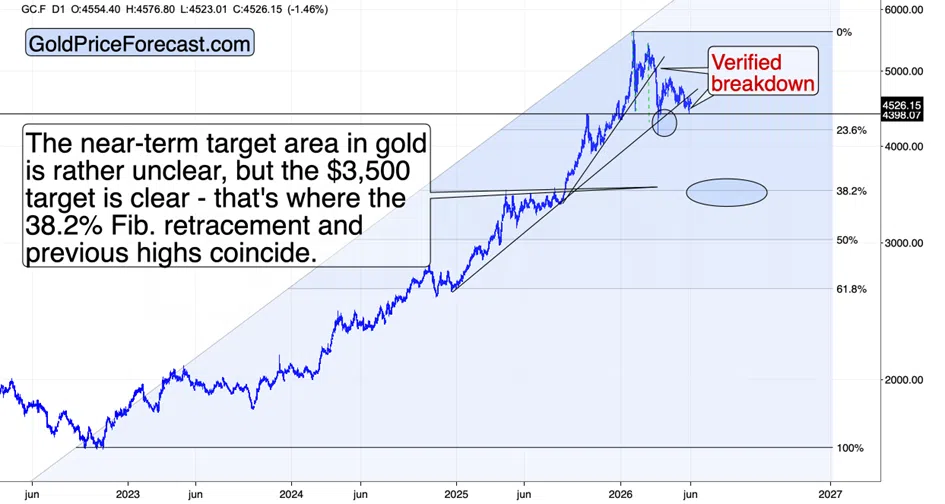
Figure 2 - COMEX Gold Futures
Not really. Once again, let’s quote what I wrote in the previous days (on Feb. 4):
In yesterday’s analysis, I wrote that the yellow metal’s breakdown below the rising red support line was not yet confirmed, but that the situation had already become more bearish. Gold closed below this line for the second day yesterday and given today’s decline, it seems that it’s going to close below it for the third consecutive day. This means that the breakdown is almost confirmed, and the implications are strongly bearish.
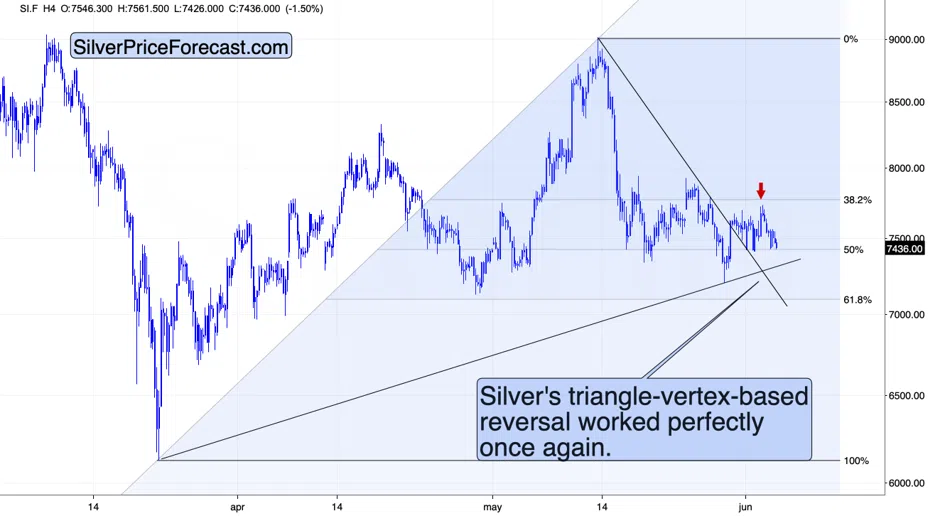
Now, given the proximity of the triangle-vertex-based reversal, I wouldn’t rule out a quick comeback and then another downturn within the next several days.
Theoretically, it’s possible that gold slides to $1,700 shortly and reverses there, but we wouldn’t bet the farm on this happening this or the next week. However, it is very likely to take place in February (more likely) or in March (less likely).
That’s exactly what we saw – a quick comeback. Gold is currently approximately at its triangle-vertex-based reversal, which means that it’s likely to reverse and decline any day or hour now.
So, again, nothing changed with regard to the outlook and nothing would likely change if gold moves a little higher from here as well (in analogy to the USD Index moving a little lower). What we’re seeing is either normal during a bigger upswing (post-breakout verification in the USD Index) or its direct consequence that fits other technical signs (gold’s quick comeback).
What about silver, did the white metal change anything?
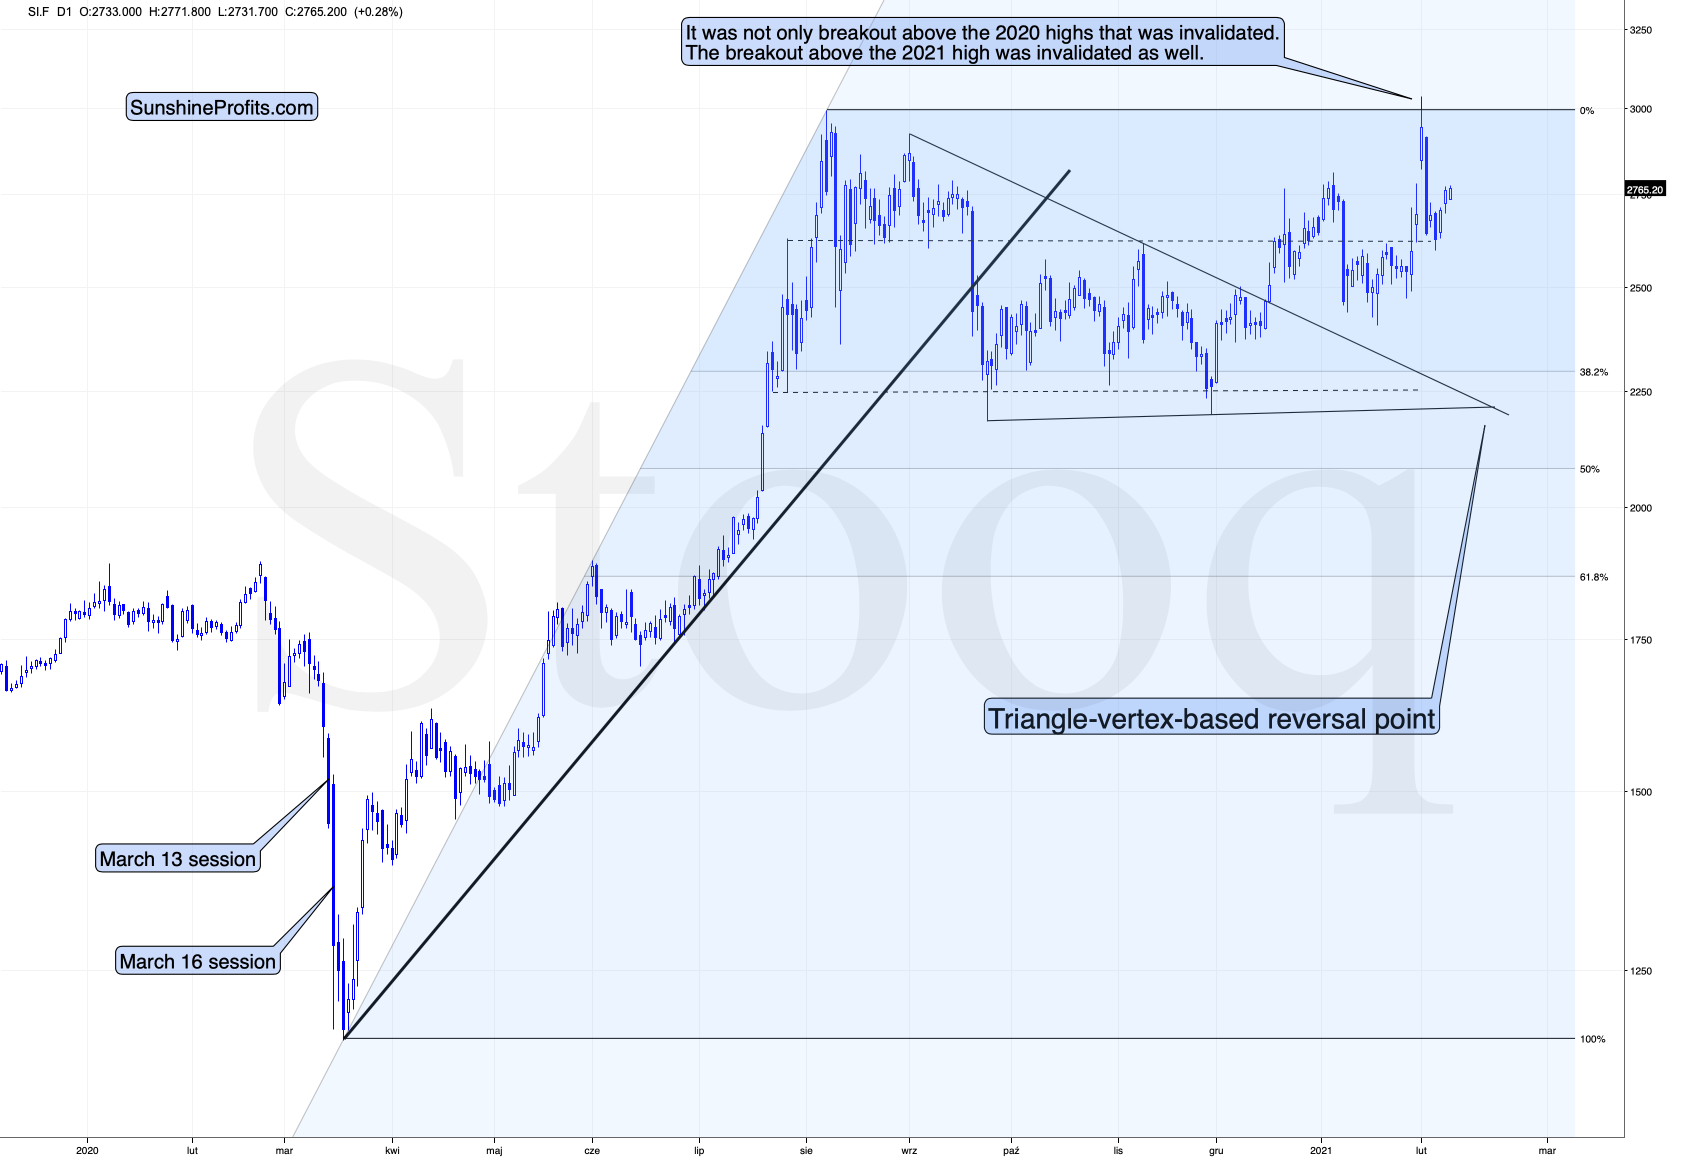
Figure 3 - COMEX Silver Futures
Not really. Just like gold, silver is taking a breather after the increased volatility. This is normal.
And the miners?
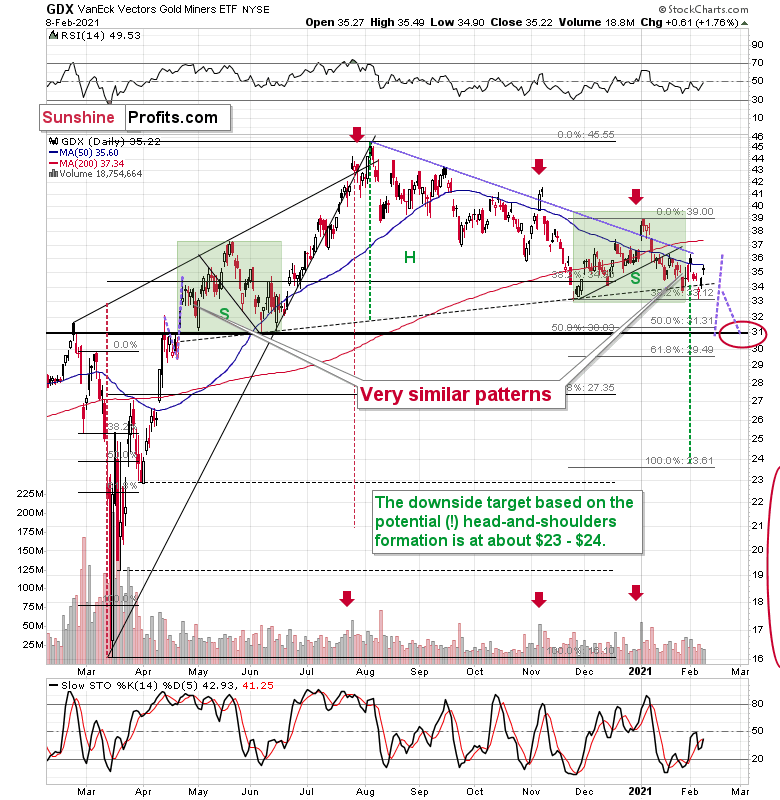
Figure 4 - VanEck Vectors Gold Miners ETF (GDX)
Mining stocks are declining in a relatively regular manner as well. After their early January top, they declined profoundly, and since that time they have also been declining, but at a slower pace. We’ve been seeing lower highs and lower lows in the past month or so, and yesterday’s upswing fits this pattern very well.
Ever since the mid-September breakdown below the 50-day moving average, the GDX ETF was unable to trigger a substantial and lasting move above this MA. The times when the GDX was able to move above it were also the times when the biggest short-term declines started.
So, did anything change yesterday? Not really.
The most recent move higher only made the similarity of this shoulder portion of the bearish head-and-shoulders pattern to the left shoulder (figure 4 - both marked with green) bigger. This means that when the GDX breaks below the neck level of the pattern in a decisive way, the implications are likely to be extremely bearish for the next several weeks or months.
Due to the uncanny similarity between the two green rectangles, I decided to check what happens if this mirror-similarity continues. I used purple, dashed lines for that. There were two important short-term price swings in April 2020 – one shows the size of the correction and one is a near-vertical move higher.
Copying these price moves (purple lines) to the current situation, we get a scenario in which GDX (mining stocks) moves to about $31 and then comes back up to about $34. This would be in perfect tune with what I wrote previously. After breaking below the head-and-shoulders pattern, gold miners would then be likely to verify this breakdown by moving back up to the neck level of the pattern. Then, we would likely see another powerful slide – perhaps to at least $24.

Comments
Log in or sign up to join the conversation.