


Published research often becomes part of the permanent investment toolkit. Findings are cited, models are calibrated, and strategies are built. Empirical relationships estimated decades ago can continue to influence decisions long after the original sample ends, but there are really two different questions. Can a published result be reproduced using the original sample? And does the same result continue to hold when new data arrive? This paper separates those questions across an unusually large sample of empirical finance research. Using an autonomous LLM-based replication pipeline, the author reconstructs the main result of 1,328 papers published in the Journal of Finance, Journal of Financial Economics, and Review of Financial Studies between 2000 and 2020. Of those, 1,005 can also be tested in later data.
The result is reassuring in one sense and much less reassuring in another. Published finance is largely reproducible in its original samples. But many of those same findings weaken substantially once the original sample ends.
Does Empirical Finance Replicate?
Dmitriy Muravyev
Working Paper, 2026
A version of this paper can be found here
Want to read our summaries of academic finance papers? Check out our Academic Research Insight category
Key Academic Insights
Published Finance Is Largely Reproducible in the Original Sample
The paper finds relatively strong in-sample reproducibility. Around 75% of key published results retain their original sign and statistical significance when independently reconstructed. The median replicated coefficient is 93% of the published magnitude. Only 1.3% of key estimates become statistically significant with the opposite sign. Most failures instead involve results losing statistical significance.
Results Weaken Substantially in New Data
The picture changes sharply out of sample. Only 42% of key results retain their published sign and significance in later years. Adjusting for the lower precision associated with shorter post-sample periods raises that figure to 48%, but the decline remains substantial. More importantly, the median coefficient falls from 93% of the published estimate in sample to only 45% in later data.
The Biggest Drop Occurs When the Original Sample Ends
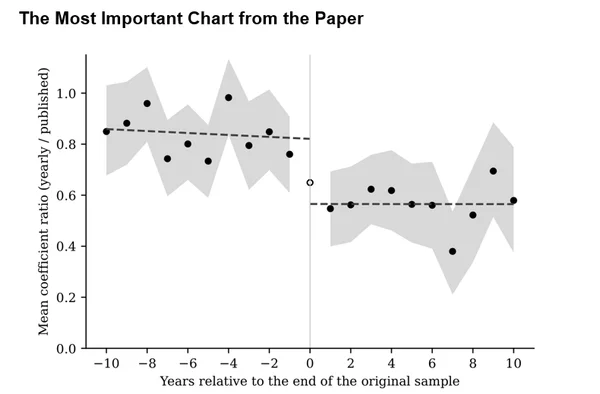
The timing of the decline is particularly revealing. When the author re-estimates each result year by year, coefficient magnitudes remain relatively stable throughout the original sample, fall sharply around the end of that sample, and then remain relatively flat afterward. The estimated coefficient ratio falls by about 0.28 when the sample ends, with no clear additional decline when the paper is eventually published. The paper interprets this pattern as being more consistent with original-sample selection or data snooping than with gradual market change or investor learning after publication.
Stronger Original Evidence Is More Durable
Not all findings decay equally. The strength of the original statistical evidence is the clearest predictor of persistence. In the weakest quartile of published results, only about 31% retain their sign and significance out of sample after adjusting for precision, and roughly one-third of the original coefficient remains. In the strongest quartile, approximately 72% retain their category and the median coefficient ratio is 0.62. Even very strong findings weaken, but they tend to hold up substantially better than marginal ones.
Publication Selection Explains Only a Fraction of the Decline
The author also asks whether conventional publication bias can explain the deterioration. Two fitted publication-selection models predict that around 90% of the published coefficient should survive in later data. In reality, the median retention is only 45%. Under these models, publication selection explains roughly one-fifth of the observed decay. The remaining gap could reflect specification search, changes in underlying economic relationships, model misspecification, or other forces.
Practical Applications for Investment Advisors
Treat Published Effect Sizes as Starting Points, Not Permanent Constants
A statistically significant historical relationship may be real and reproducible within the original data while still overstating the magnitude that investors should expect going forward. Advisors using academic estimates for expected returns, risk premiums, factor exposures, or portfolio assumptions should consider applying substantial caution to historical point estimates.
Distinguish Replication from Out-of-Sample Validation
Successfully reproducing a published paper is important, but it answers only one question. It shows that the published result can be recovered. It does not show that the relationship remains economically meaningful in future data.
Pay Attention to the Strength of the Original Evidence
Marginal statistical significance deserves particular scrutiny. The study finds that results supported by much stronger original t-statistics are considerably more durable. Advisors should therefore look beyond whether a result crosses a conventional significance threshold and consider how strong the underlying evidence actually is.
Favor Evidence That Survives Multiple Samples and Market Environments
When incorporating academic findings into investment processes, greater weight can be placed on results that have been independently replicated and subsequently tested in new data. Evidence accumulated across periods may be more informative than one especially strong estimate from a single historical sample.
How to Explain This to Clients
“Academic research can uncover valuable investment insights, but a published result is not necessarily a permanent law of finance. This study finds that most important finance results can be reproduced reasonably well using the data originally studied. The problem comes when researchers move into new data. On average, the effects become much smaller. The typical finding retains less than half of its originally published magnitude. That does not mean academic research is unreliable. It means we should distinguish between discovering an interesting historical relationship and establishing that the relationship is strong enough to survive in the future”
The Most Important Chart from the Paper
This chart plots the median ratio of replicated to published coefficients by year relative to the end of each paper’s original sample. The ratio is roughly flat within the sample, falls sharply at the boundary, and stays roughly flat afterward, including after circulation and publication.
The results are hypothetical results and are NOT an indicator of future results and do NOT represent returns that any investor actually attained. Indexes are unmanaged and do not reflect management or trading fees, and one cannot invest directly in an index.
Abstract
An autonomous LLM pipeline rebuilds each result from the paper and available databases, with independent audits of every replication. I obtain 1,328 in-sample replications, 1,005 with enough post-sample data for an out-of-sample test. In sample, 75% reproduce the published sign and significance, and the median coefficient recovers 0.93 of the published value. Out of sample, the rate falls to 42%, and the median coefficient ratio to 0.45. The coefficient ratio drops sharply when the original sample ends and is flat on either side, consistent with data snooping rather than investor learning or gradual market change. Although original t-statistics strongly predict persistence, standard models of publication selection explain only about one-fifth of the overall decay. Published finance is largely reproducible in its original samples but much less durable in later data.



Comments
Log in or sign up to join the conversation.