

We have long regarded value and momentum as the “varsity” factors in stock selection. Decades of academic research, including our own, have shown that, historically, buying cheap stocks and buying winners has been associated with higher average returns. Not always, not guaranteed, but on average and over long periods of time. Arguably, the most robust academic paper on this topic comes via Asness, Moskowitz, and Pedersen’s “Value and Momentum Everywhere.” Notably, the authors went beyond stock selection and provided evidence that these factors also earned positive average returns in equity indexes, bonds, currencies, and commodities over their sample period. The conclusion? Value and momentum appeared far more robust than previously shown.
But 2013 was a long time ago. We can look at a decent “out-of-sample” test. Since publication, empirical results have been mixed, or just plain awful, depending on who you ask. Of course, one can expect some level of return decay after publication. But how much decay can one handle before suspecting that a strategy has been “arbed” away, or that it never existed in the first place?
Testing Value and Momentum Everywhere Since 2013
In this post, we will examine how factor portfolios have performed since “Value and Momentum Everywhere” was published, evaluating the return window from July 2013 to July 2026. To do so, we will analyze the following value, momentum, and combination portfolios:
“Everywhere” (Long/Short)
Stock Selection (Long/Short)
U.S. Stocks (Long/Short)
Source: AQR Capital Management and Kenneth R. French Data Library; Alpha Architect calculations. The results are hypothetical results and are NOT an indicator of future results and do NOT represent returns that any investor actually attained. Indexes are unmanaged and do not reflect management or trading fees, and one cannot invest directly in an index.
And:
U.S. Stocks (Long-only)
Source: AQR Capital Management and Kenneth R. French Data Library; Alpha Architect calculations. The results are hypothetical results and are NOT an indicator of future results and do NOT represent returns that any investor actually attained. Indexes are unmanaged and do not reflect management or trading fees, and one cannot invest directly in an index.
A note on the data: All returns in this post are hypothetical and are calculated from AQR’s public Value and Momentum Everywhere factor and portfolio datasets and from Kenneth French’s Data Library. These are paper portfolios: they do not reflect management fees, transaction costs, or taxes; none of them can be bought as presented, and no investor actually earned these returns. Combination portfolios are 50% value and 50% momentum, rebalanced monthly. AQR’s returns are already in excess of T-bills, so Sharpe ratios are average return divided by volatility. AQR rebuilds its full history with each update, so these are not the exact portfolios published in 2013, and a later download may produce slightly different figures. AQR is not affiliated with Alpha Architect and has not reviewed or endorsed this analysis. Third-party data is believed reliable, but its accuracy is not guaranteed.
Everywhere, All at Once
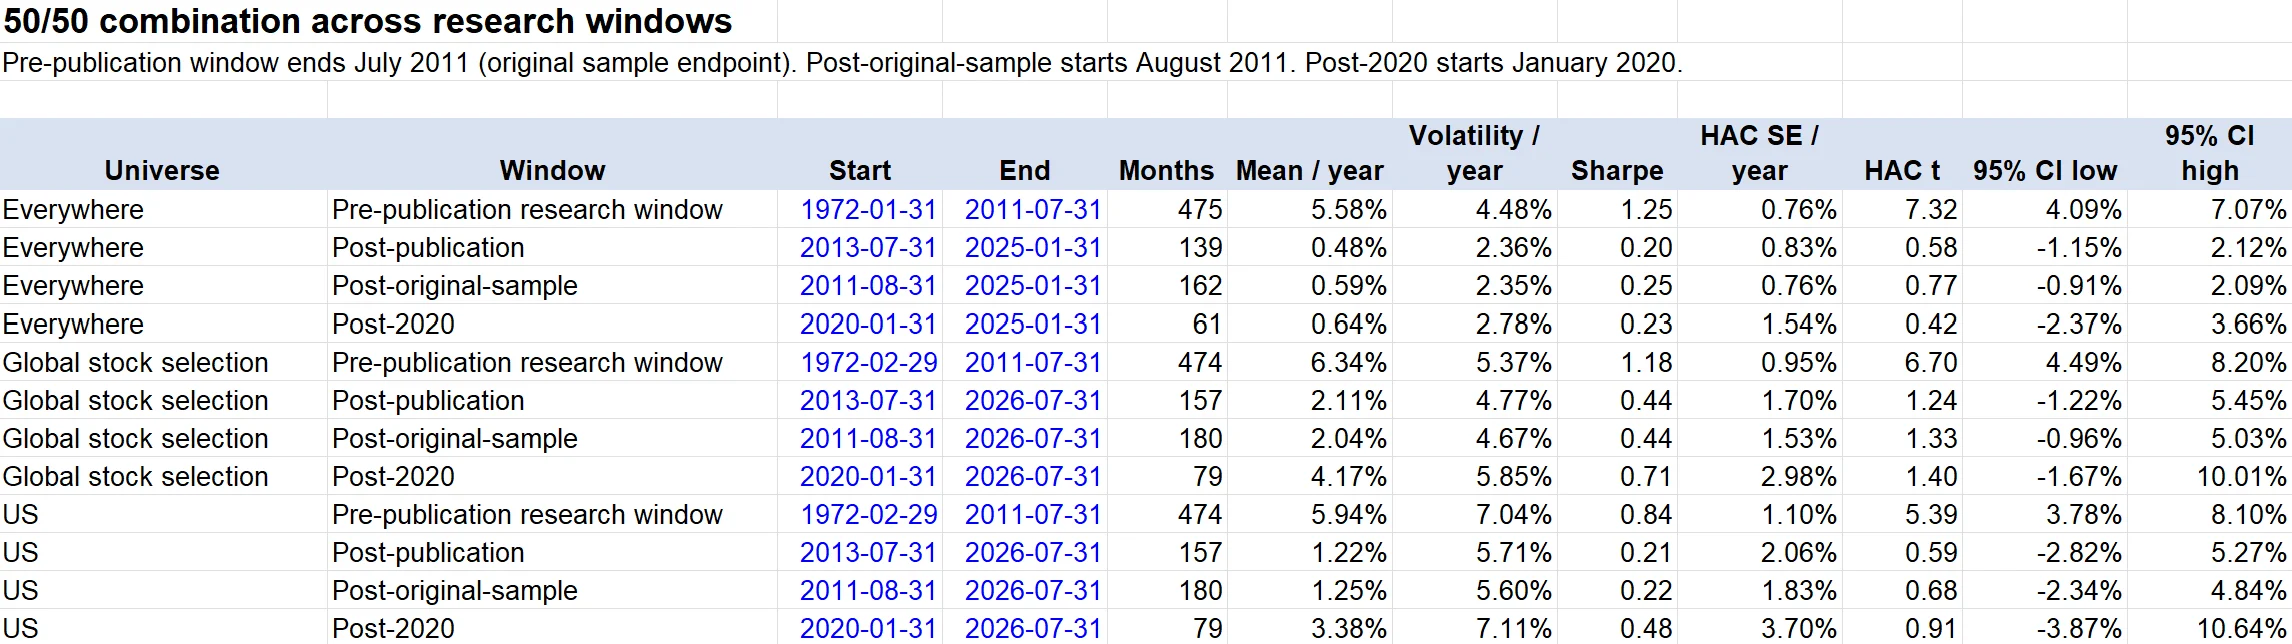
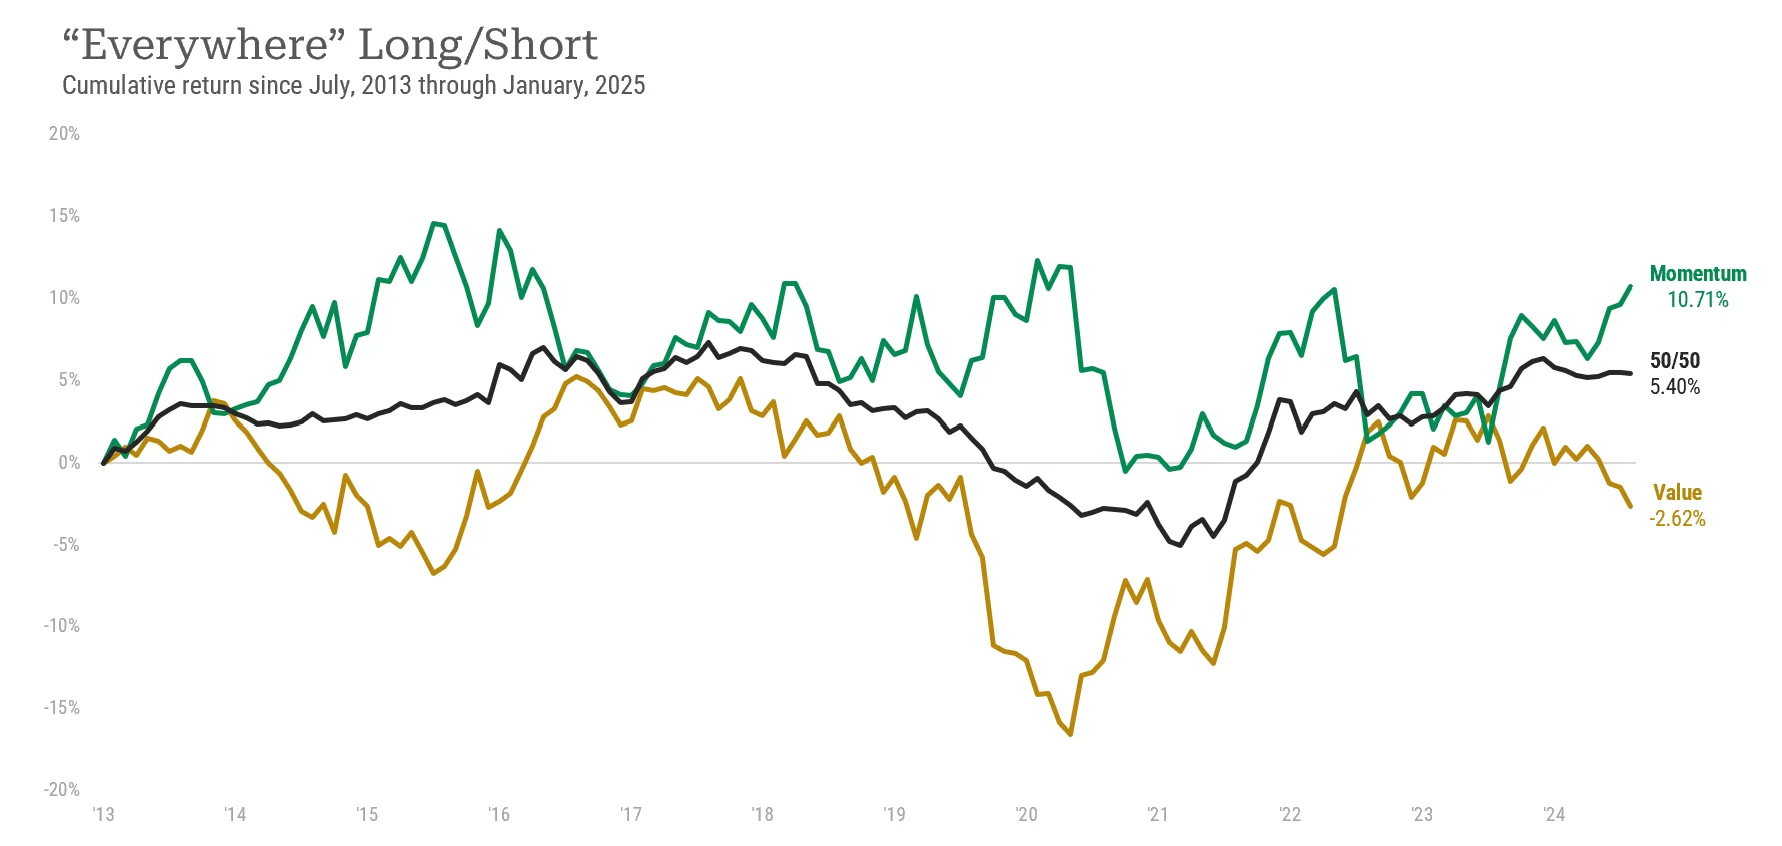
We first examine results on the “everywhere” portfolio, which includes a mix of U.S. stocks, U.K. stocks, European stocks, Japanese stocks, equity indexes, bonds, currencies, and commodities. Prior to publication, this long/short portfolio enjoyed a 5.58% average annual return and 4.48% volatility for a 1.25 Sharpe. Post-publication, while marginally positive, returns dropped to an annual average of 0.48% and volatility to 2.36%, for a 0.20 Sharpe. Since publication, a combination portfolio of 50% value and 50% momentum returned a cumulative 5.40%, with momentum returning 10.71% and value losing 2.62%.
Source: AQR Capital Management and Kenneth R. French Data Library; Alpha Architect calculations. The results are hypothetical results and are NOT an indicator of future results and do NOT represent returns that any investor actually attained. Indexes are unmanaged and do not reflect management or trading fees, and one cannot invest directly in an index.
Value’s lag is most evident during the 2018-2020 “quant winter.” As we continue our review, it will be important to take note of patterns in the data before forming any conclusions.
Stock Selection Around the Globe
Next, we turn to global stock selection factors and look at four stock markets: the U.S., the U.K., Europe, and Japan. Prior to publication, value and momentum portfolios earned 6.34% per year, on average, with a volatility of 5.37% for a 1.18 Sharpe. Post-publication, average annual returns fell to a measly 2.11%, while volatility dropped to 4.77% for a 0.44 Sharpe. The combination portfolio returned a cumulative 29.87%, with value posting a -6.95% cumulative return, and momentum making up for value’s crummy losses with a 60.69% cumulative return.
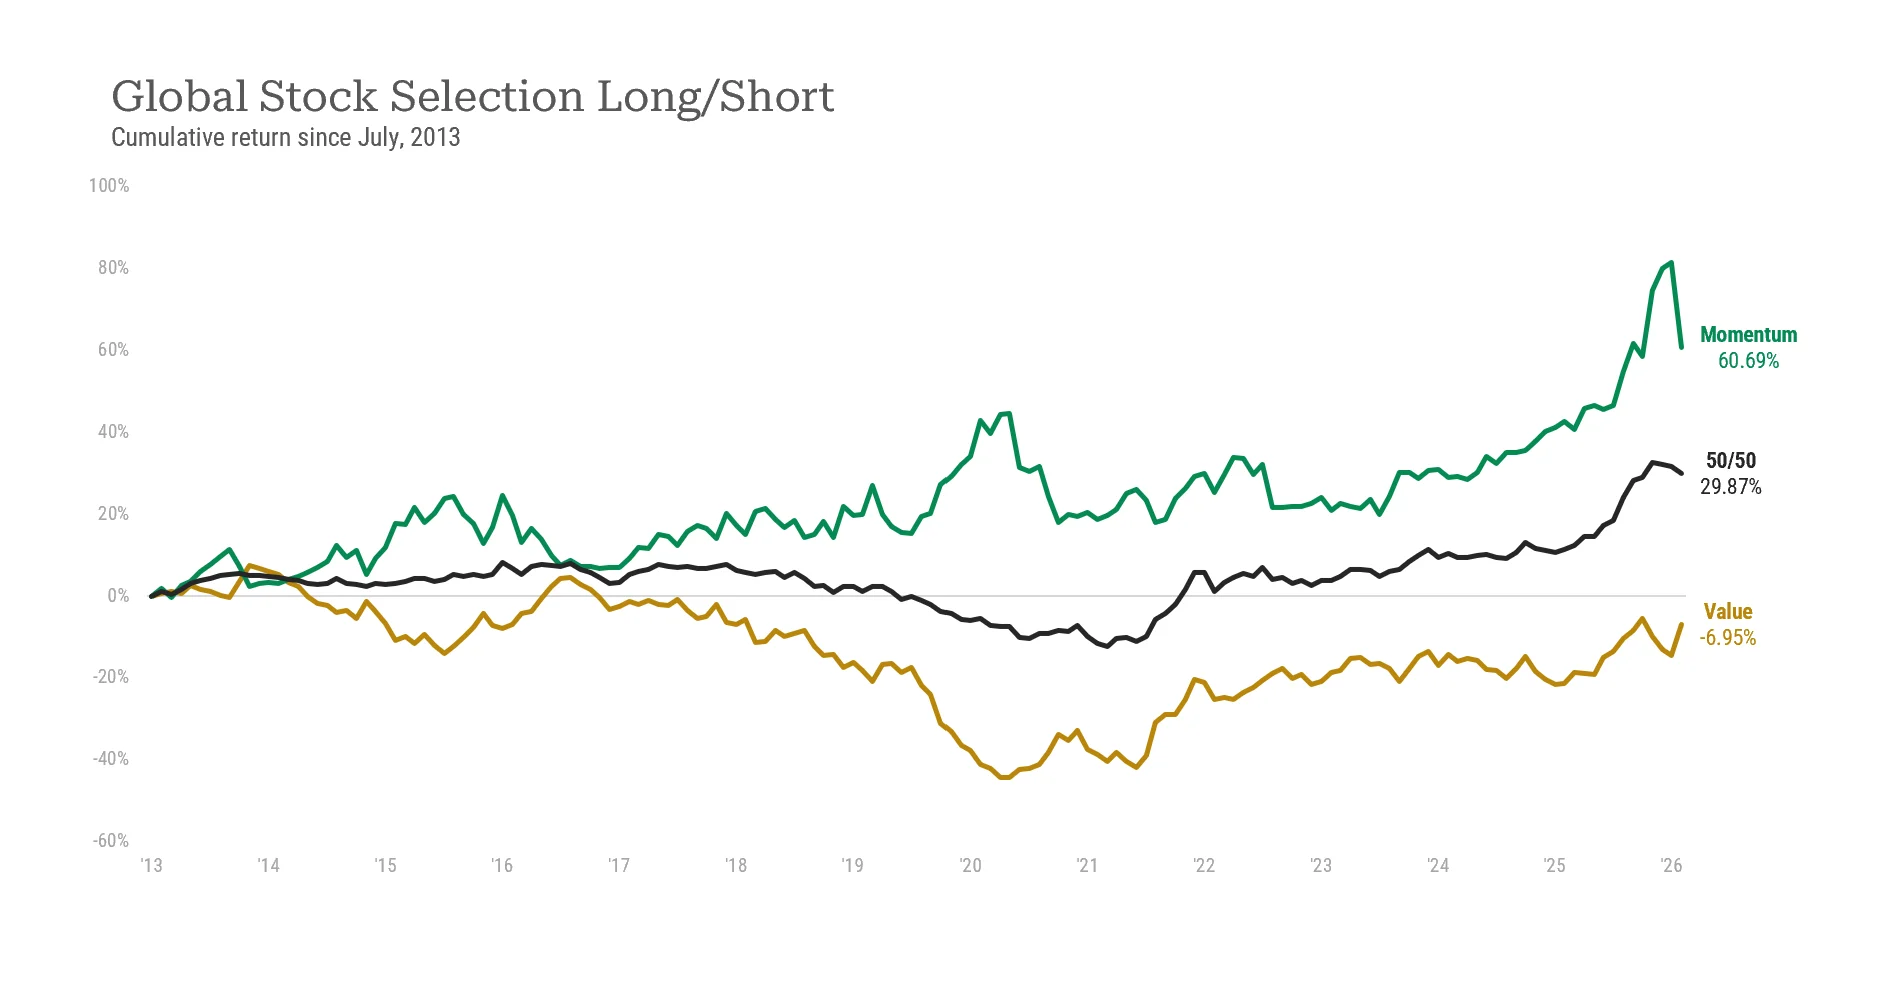
Source: AQR Capital Management and Kenneth R. French Data Library; Alpha Architect calculations. The results are hypothetical results and are NOT an indicator of future results and do NOT represent returns that any investor actually attained. Indexes are unmanaged and do not reflect management or trading fees, and one cannot invest directly in an index.
Similar to the “everywhere” portfolio, there’s a notable drag in performance in the late 2010s: value posted negative returns while momentum kept the combination portfolio positive.
U.S. Factors
Turning to the U.S., pre-publication annual returns stood at 5.94% with 7.04% volatility for a 0.84 Sharpe. Post-publication, returns flattened to 1.22%, while volatility also dropped to 5.71% for a Sharpe of 0.21. The combination portfolio returned a cumulative 14.92%, with value returning -39.99% and momentum 84.68%.
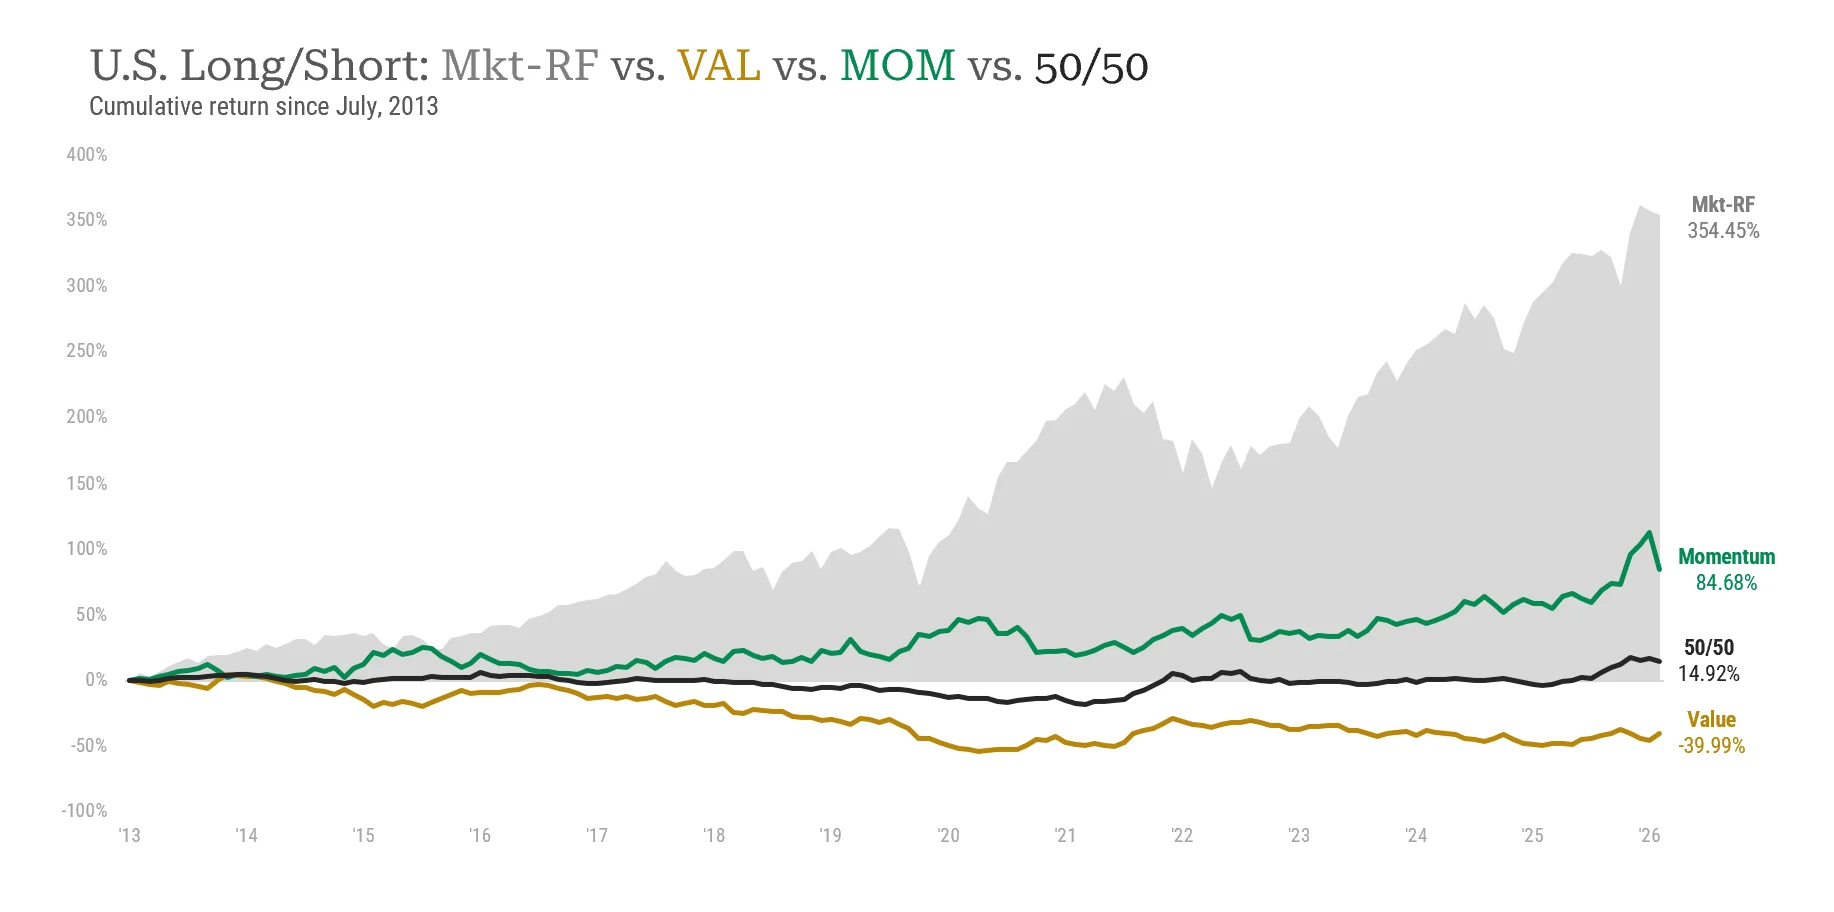
Source: AQR Capital Management and Kenneth R. French Data Library; Alpha Architect calculations. Mkt-RF is the market’s return above T-bills, shown for reference. The long/short portfolios are dollar-neutral, so the lines are not directly comparable. The results are hypothetical results and are NOT an indicator of future results and do NOT represent returns that any investor actually attained. Indexes are unmanaged and do not reflect management or trading fees, and one cannot invest directly in an index.
Here, the pattern repeats: value suffers the most, underperformance is most pronounced in the late 2010s, and momentum offsets much of the damage. Interestingly, while factors lagged more in the U.S. than in the global stock selection portfolio, momentum, in particular, posted even stronger returns than it did in the global portfolio.
U.S., Long-Only
Finally, we conclude with a portfolio with a closer resemblance to how most investors approach factor investing: long-only U.S. stocks.
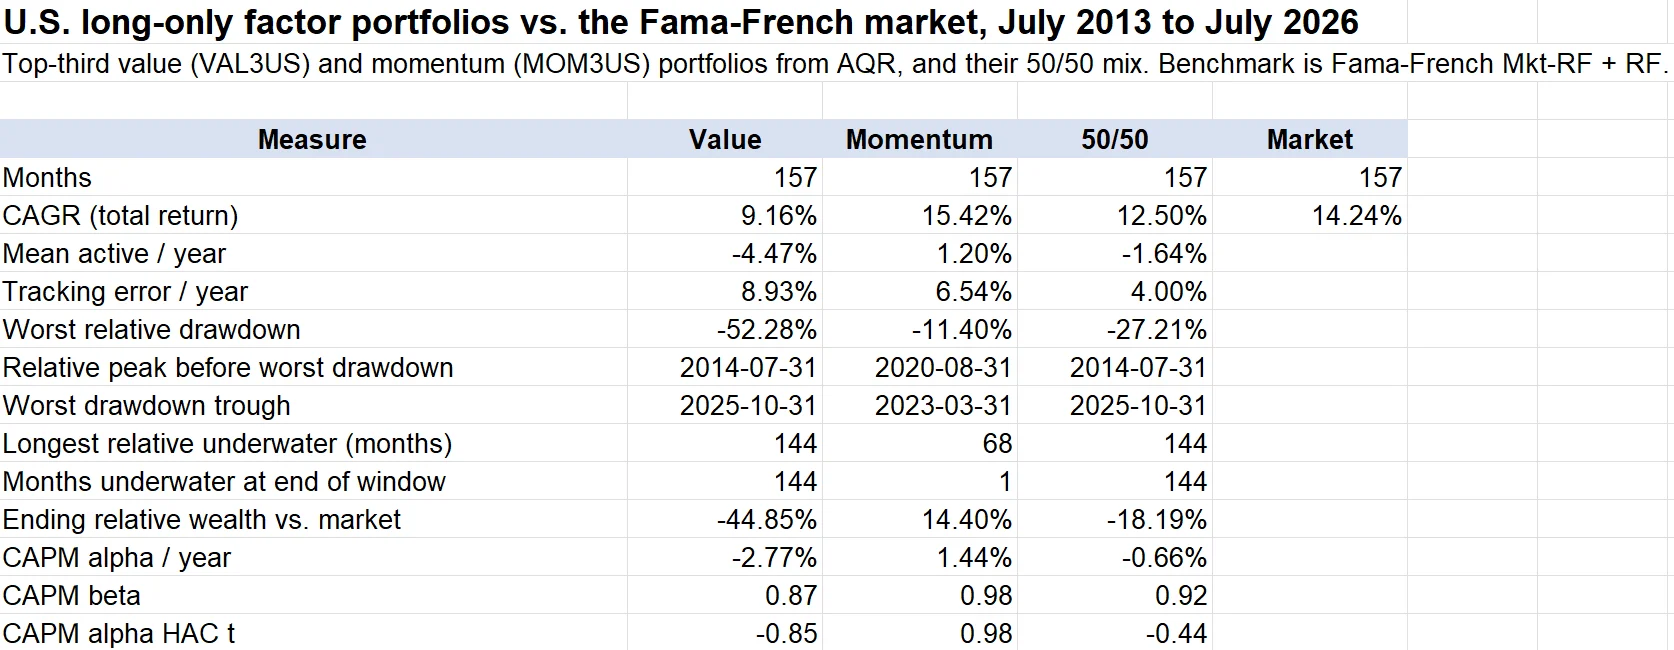
Prior to publication, a long-only U.S. portfolio composed of 50% value and 50% momentum enjoyed a statistically significant CAPM alpha of 3.03% (t=5.55). Post-publication, alpha decayed to a statistically insignificant -0.66% (t=-0.44).
The combination portfolio posted a CAGR of 12.50% to the market’s 14.24%. Momentum compounded at 15.42% and value at 9.16%.
Notably, the 50/50 combo suffered a 27.21% maximum drawdown relative to the market, from a peak in July 2014 to a trough in October 2025, compared to a milder 8.47% in the pre-publication sample.
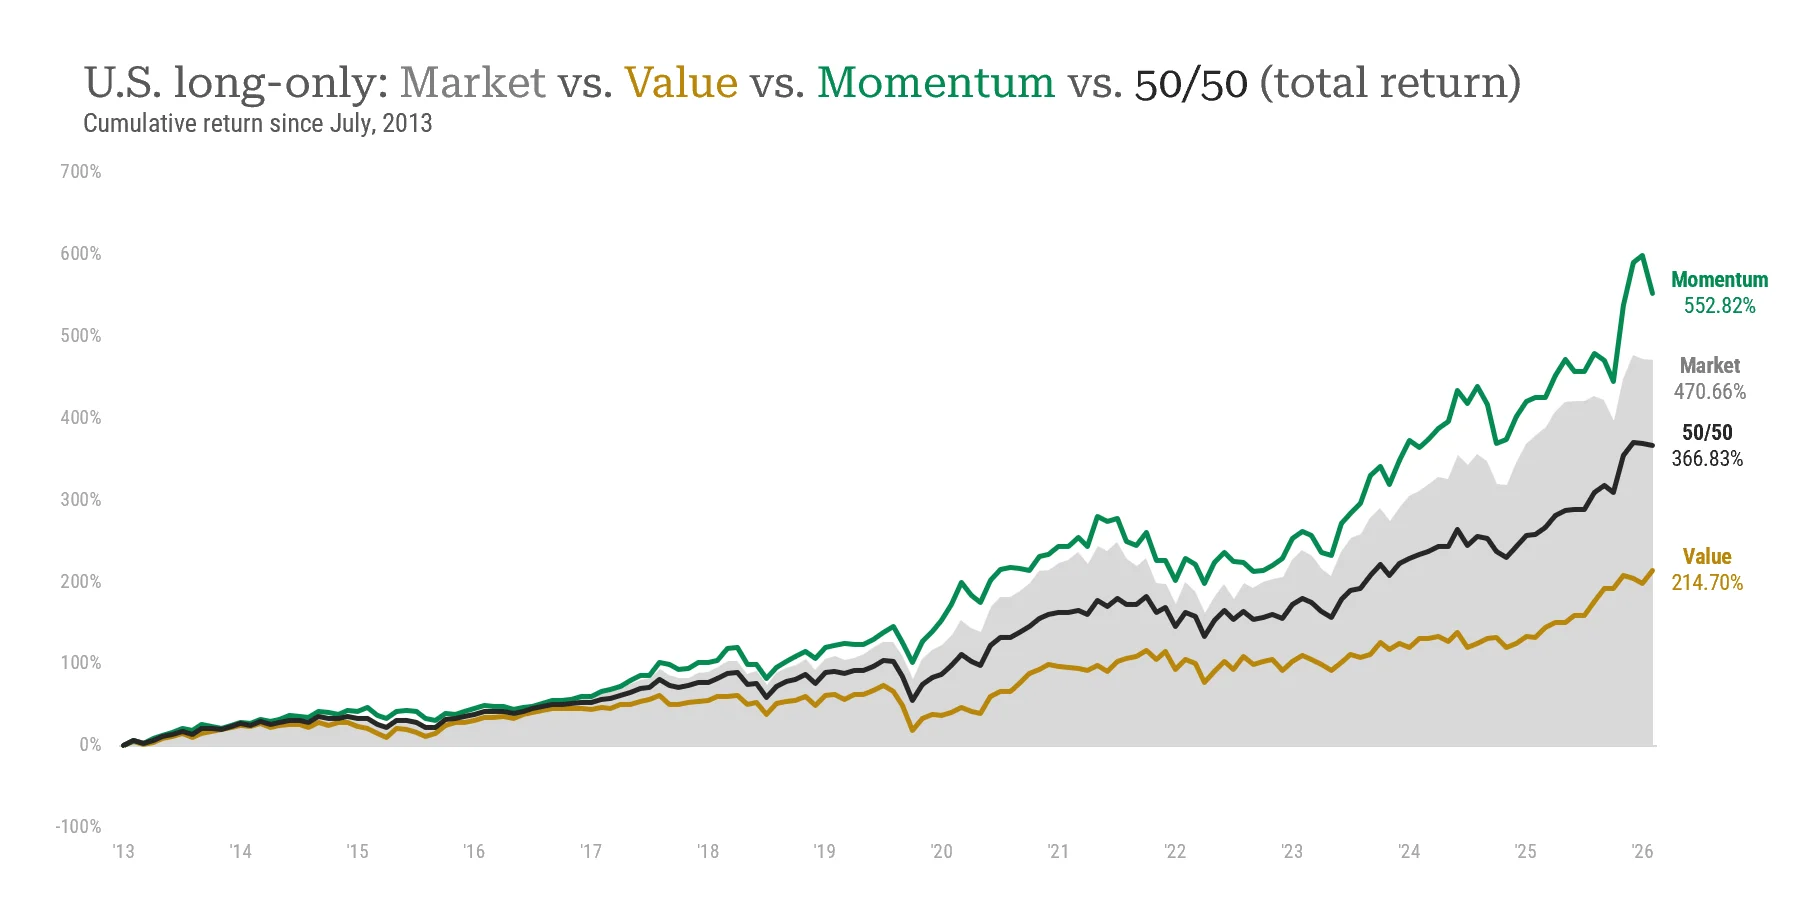
Source: AQR Capital Management and Kenneth R. French Data Library; Alpha Architect calculations. The results are hypothetical results and are NOT an indicator of future results and do NOT represent returns that any investor actually attained. Indexes are unmanaged and do not reflect management or trading fees, and one cannot invest directly in an index.
The same patterns hold here: value lags the market, and momentum does the heavy lifting.
Are Value and Momentum Still Everywhere?
This piece adds yet more to the accumulating evidence of post-publication return decay. While concerning for factor investors, a more practical question is: can we still expect positive factor premia going forward?
Unfortunately, no such answer will be provided here.
Having said that, in the remainder of this post, we will give you three reasons why the data, while concerning, are, in our view, not inconsistent with the core argument of the original paper and the historical arguments for factor investing.
1. The “Quant Winter” Air Pocket
Risk-taking is at the core of factor investing. The theory is that investors can expect higher returns for bearing factor risk, but they are not guaranteed them, because sometimes those risks show up.
Of the infinite possible return paths an investor could experience, the “quant winter” of the late 2010s was a realization of that risk. This air pocket serves as a piece of evidence, and a warning, of the path dependency that can result from risk-taking.
Since the start of 2020, global stock selection factors have posted a Sharpe of 0.71, much closer to their pre-publication Sharpe of 1.18. That start date is our choice, and any start date picked after a drawdown can flatter the result, so this is not proof of a recovery. Its average return is also not statistically significant (t=1.40), so it can’t separate a temporary slump from a permanently lower premium. Still, it hints that some of the weakness above may be tied to one rough stretch. In short, quant winter losses may serve more as a lesson in path dependency than as an indictment of factors themselves.
2. Is the Argument Dead?
Three of the most important findings of “Value and Momentum Everywhere” are as follows:
Value and momentum earned positive average returns across global asset classes and…
were positively correlated with their counterparts across asset classes but…
negatively correlated with each other.
The paper examines value and momentum simultaneously. As such, when looking at combination portfolios, the post-publication data do not contradict any of these three findings. Strategy by strategy, the first finding looks weaker: 7 of the 16 individual value and momentum strategies, including U.S. value, Japanese momentum, and commodity momentum, had negative average returns after publication.
While all three long/short value and momentum combination portfolios post mildly positive returns, there are 139 monthly observations for the “everywhere” portfolio and 157 monthly observations for the stock selection portfolios. With samples this small, the results are not statistically significant. The bad news? These positive returns might as well be noise. The good news? The estimates are imprecise, so more data could still move returns closer to pre-publication results. It could just as easily confirm the decay. That said, this isn’t necessarily “good” news, maybe “hopeful” news.
Across all four portfolio sets, the story is the same: value sucked wind, and momentum carried the combination portfolios. Each factor also still moved in step across asset classes. By our calculations from AQR’s public data, the average pairwise correlation across the eight asset classes was 0.27 for value and 0.33 for momentum after publication, versus 0.16 and 0.23 over the original paper’s sample period.
In all eight asset classes, value and momentum stayed negatively correlated with each other (between -0.43 and -0.67 after publication). Did value’s heavy underperformance make us question everything we know and give us a mini heart attack? Yes. On the flip side, given an ex-ante expectation of negative correlation, did momentum offset these losses? Also yes.
3. The Case for the Risk Story
We now turn our eyes to the party responsible for all our woes: value. Why did value behave so poorly during this period? The theories are endless: passive flows, technological revolutions, interest rates, retail mania, overextrapolation… risk!
If value’s poor run reflects a risk that investors are paid to bear, that risk would be expected to be rewarded eventually, though there is no timetable and no guarantee. That is a hypothesis this post does not test. The original paper found that funding liquidity risk explains only part of value and momentum’s behavior, and it does not explain why the 50/50 combination earns a premium. Value’s underperformance in the U.S. was accompanied by the valuation gap between cheap and expensive stocks widening to near-record levels. Some recent data have been more encouraging, but a few better years do not confirm a comeback. If history is any guide, there may be nothing out of the ordinary here: it may all just be how risk happened to play out in our time.



Comments
Log in or sign up to join the conversation.