


The Walt Disney Company (DIS) generated 89% higher FCF in fiscal Q4, ending Oct. 3, but only 4.9% higher for the year. Moreover, in the Nov. 17, 2026, shareholder letter, management guided FCF up just 4% for next year. So, is DIS stock at a peak?
DIS closed down about 1.7% on Friday at $118.11, after rising to a 6-month peak after its results release. Moreover, since its recent low of $101.33 on Oct. 1, DIS stock is up 17.0%.
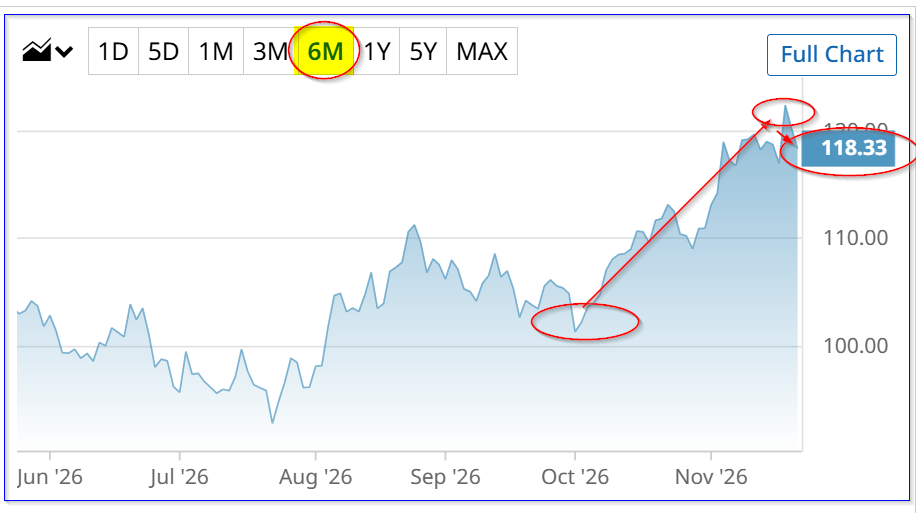
DIS stock - last 6 months - Barchart - Nov. 20, 2026
Mediocre FCF Growth
FCF for FY 2026 came in at $10.572 billion, just 4.9% higher than the $10.077 billion, as seen on page 11 of its shareholder letter. Moreover, its annual FCF margin fell from 10.67% of revenue last year to 10.33% this year, according to Stock Analysis.
So, since analysts project 4.0% higher revenue in 2027 at $106.52 billion next year, and management is forecasting just $11.0 billion in FCF (i.e., up 4.05%), the FCF margin should stay level at 10.33% next year.
The problem is this mediocre growth rate is already discounted in the stock price after its recent rise. Moreover, analysts and the market want to see better than mediocre FCF growth and higher FCF margins.
DIS Price Targets
Nevertheless, analysts still see DIS stock as undervalued. For example, 32 analysts surveyed by Yahoo! Finance have an average price target (PT) of $131.34. That's about 10.7% higher.
Barchart's mean survey PT is slightly higher at $132.22, and AnaChart's survey of 20 analysts has an average of $132.31. AnaChart's average PT tends to be based on more recent analysts' write-ups. These last 2 PTs are 11.4% higher than its close on Friday.
So, if FCF will only be 5% higher, as management projects, why do these analysts still think there is 10-11% upside left in the stock?
One reason could be that DIS is trading well below its historical average price/earnings (P/E) metric.
For example, Seeking Alpha shows that DIS's forward P/E for the past 5 years has been 21.69x. Analysts' Sept. 2027 $7.57 EPS forecast average puts DIS on a forward P/E of just $15.67x. That implies a 38.4% upside potential (21.69/15.67x-1).
Similarly, Morningstar's 18.9x 5-year historical forward P/E average implies 20.6% upside. The average of these two implies upside of 29.5%.
However, the 5% FCF growth rate provided by management dampens this potential upside. The average of 29.5% and 5.0% is 17.25% upside.
Given a 5% discount rate for one year, the potential upside is just 16.42%, or a PT of $137.34. That is close to where the average of these analysts' price targets are today.
How to Play DIS
Since there may be limited upside, it could make sense for conservative investors to wait for DIS stock to move back down.
Then the investor can do short-put plays at out-of-the-money (OTM) strike prices, or covered calls if the investor is already a shareholder. Less risk-averse investors can also do short put credit spreads.
In addition, at that point, some investors might be willing to invest in long-dated in-the-money (ITM) DIS call options.
As a result, some investors may feel it makes sense to wait until there is at least a mid-20% upside potential using several metrics.


Comments
Log in or sign up to join the conversation.